Published 4 hours ago
A rising parallel pattern has given a specific direction to the ongoing recovery in Cardano price. In response to this pattern, the buyers obtain strong support from a dynamic trendline acting as a ladder to climb higher levels. Here’s how this pattern may affect the ADA coin’s future price and how interested traders can profit from it.
Key Points:
- The ongoing recovery in the Cardano price is likely to challenge the multi-month resistance of $0.427
- The ADA price rallying with a series of new higher highs and higher lows is a key trait of sustained recovery
- The intraday trading volume in the ADA coin is $446.5 Million, indicating a 58% gain
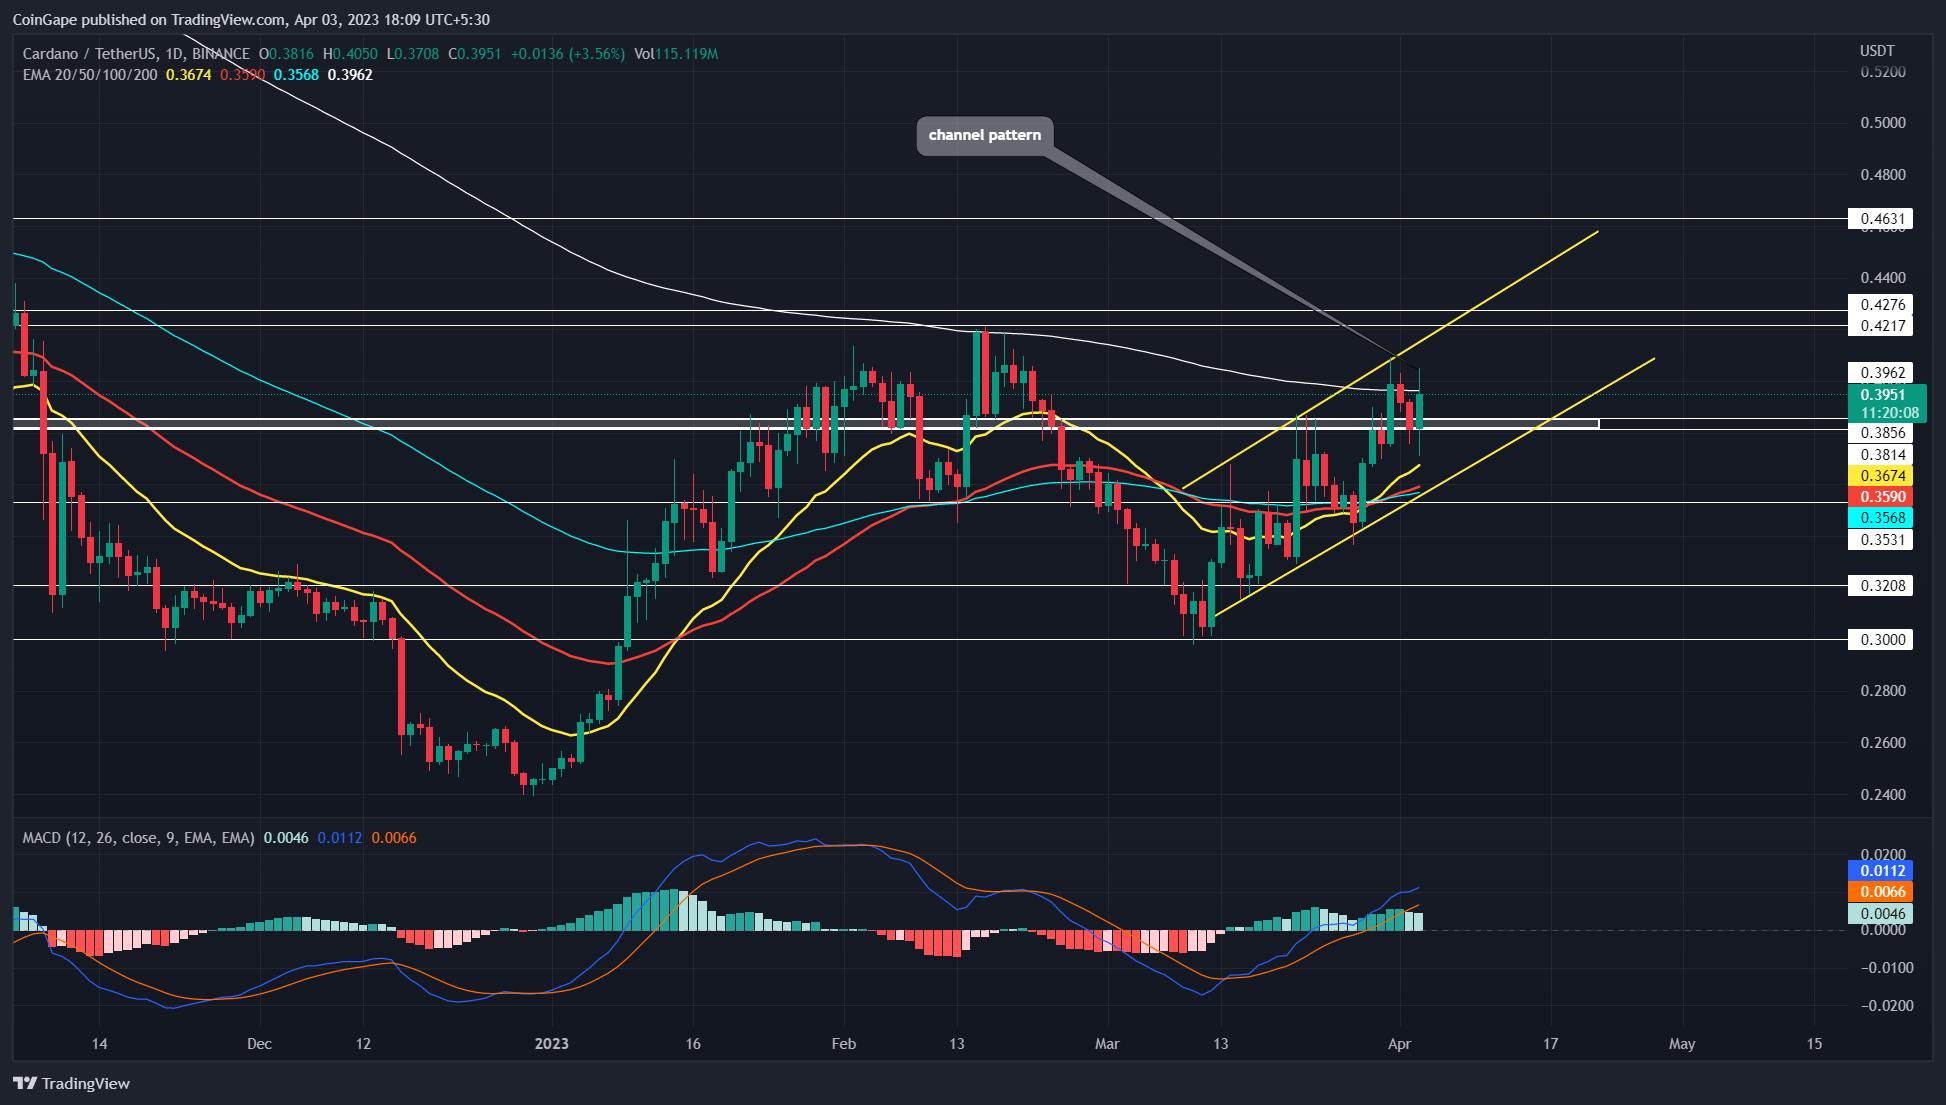
Source- Tradingview
Under the influence of a channel pattern, the V-shaped recovery in Cardano coin price has nearly recovered the losses experienced during the Mid-February to Mid-March. On March 31st, the rising price gave a decisive breakout from a local resistance of $0.385-$0.38, offering buyers additional flooring to rise higher.
Trending Stories
After a minor pullback, the ADA price jumped 3.83% from the aforementioned support and reached the current price of $0.397. This post-breakout rally will likely surge the Cardano price 7.8% higher to hit the multiple months resistance zone of $0.427-$0.42.
Also Read: What Is Regenerative Finance (Refi) And Who Is It For?
This high supply zone triggered November 2022 and February’s second-half downfall. Thus, the buyers could face strong selling pressure at the $0.42 mark, which puts the Cardano price under a correction threat.
In case of a potential reversal, a bearish breakdown from the pattern’s support trendline will give additional confirmation for a downfall.
However, until the channel pattern’s support trendline is intact, the bullish rally may continue and surpass the $0.427 barrier to reach $0.463.
Technical Indicator.
MACD: the MACD(blue) and signal line(orange) moving higher in the bullish territory indicates sustained buying in the market.
Bollinger Band: the ADA price moving between the upper and midline of the Bollinger band indicator indicates the buyers hold an upper hand.
Cardano Coin Price Intraday Levels
- Spot price: $0.396
- Trend: Bullish
- Volatility: Low
- Resistance level- $0.427 and $0.46
- Support level- $0.38 and $0.35
Share this article on:
advertisement
The presented content may include the personal opinion of the author and is subject to market condition. Do your market research before investing in cryptocurrencies. The author or the publication does not hold any responsibility for your personal financial loss.
- SEO Powered Content & PR Distribution. Get Amplified Today.
- Platoblockchain. Web3 Metaverse Intelligence. Knowledge Amplified. Access Here.
- Source: https://coingape.com/markets/this-chart-pattern-bolsters-cardano-price-for-prolong-recovery-but-theres-a-catch/
- :is
- 1
- 10
- 2022
- 7
- 8
- 9
- a
- Ad
- ADA
- ada price
- Additional
- affect
- and
- article
- AS
- At
- author
- avatar
- BAND
- banner
- barrier
- bearish
- Beauty
- before
- between
- blockchain
- Blue
- Breakdown
- breakout
- Brian
- Bullish
- buyers
- Buying
- CAN
- Cardano
- cardano price
- case
- Catch
- challenge
- Channel
- Chart
- climb
- Coin
- Coingape
- COM
- condition
- confirmation
- content
- continue
- could
- cryptocurrencies
- cryptocurrency
- Current
- decisive
- different
- direction
- downfall
- during
- dynamic
- Entertainment
- Ether (ETH)
- experienced
- Face
- Fashion
- finance
- financial
- follow
- For
- from
- future
- Future Price
- Give
- given
- hand
- Have
- High
- higher
- Highs
- Hit
- hold
- HOURS
- How
- HTTPS
- i
- in
- include
- Including
- indicates
- indicating
- influence
- interested
- investing
- IT
- journalism
- jpg
- Key
- ladder
- Last
- levels
- likely
- local
- loss
- losses
- Lows
- March
- mark
- Market
- market research
- million
- minor
- months
- moving
- multiple
- nearly
- New
- November
- obtain
- of
- offering
- on
- ongoing
- Opinion
- Orange
- Parallel
- past
- Pattern
- personal
- plato
- Plato Data Intelligence
- PlatoData
- plugin
- points
- potential
- prediction
- presented
- pressure
- price
- Price Prediction
- Profit
- Publication
- pullback
- Puts
- rally
- reach
- reached
- Read
- recovery
- ReFi
- regenerative
- Regenerative Finance
- research
- Resistance
- response
- responsibility
- Reversal
- Rise
- rising
- Selling
- Series
- Share
- Signal
- specific
- strong
- subject
- supply
- support
- surge
- surpass
- The
- threat
- to
- Topics
- Traders
- Trading
- trading volume
- TradingView
- trending
- triggered
- under
- variety
- volume
- which
- WHO
- will
- with
- working
- written
- years
- Your
- zephyrnet