Published 12 seconds ago
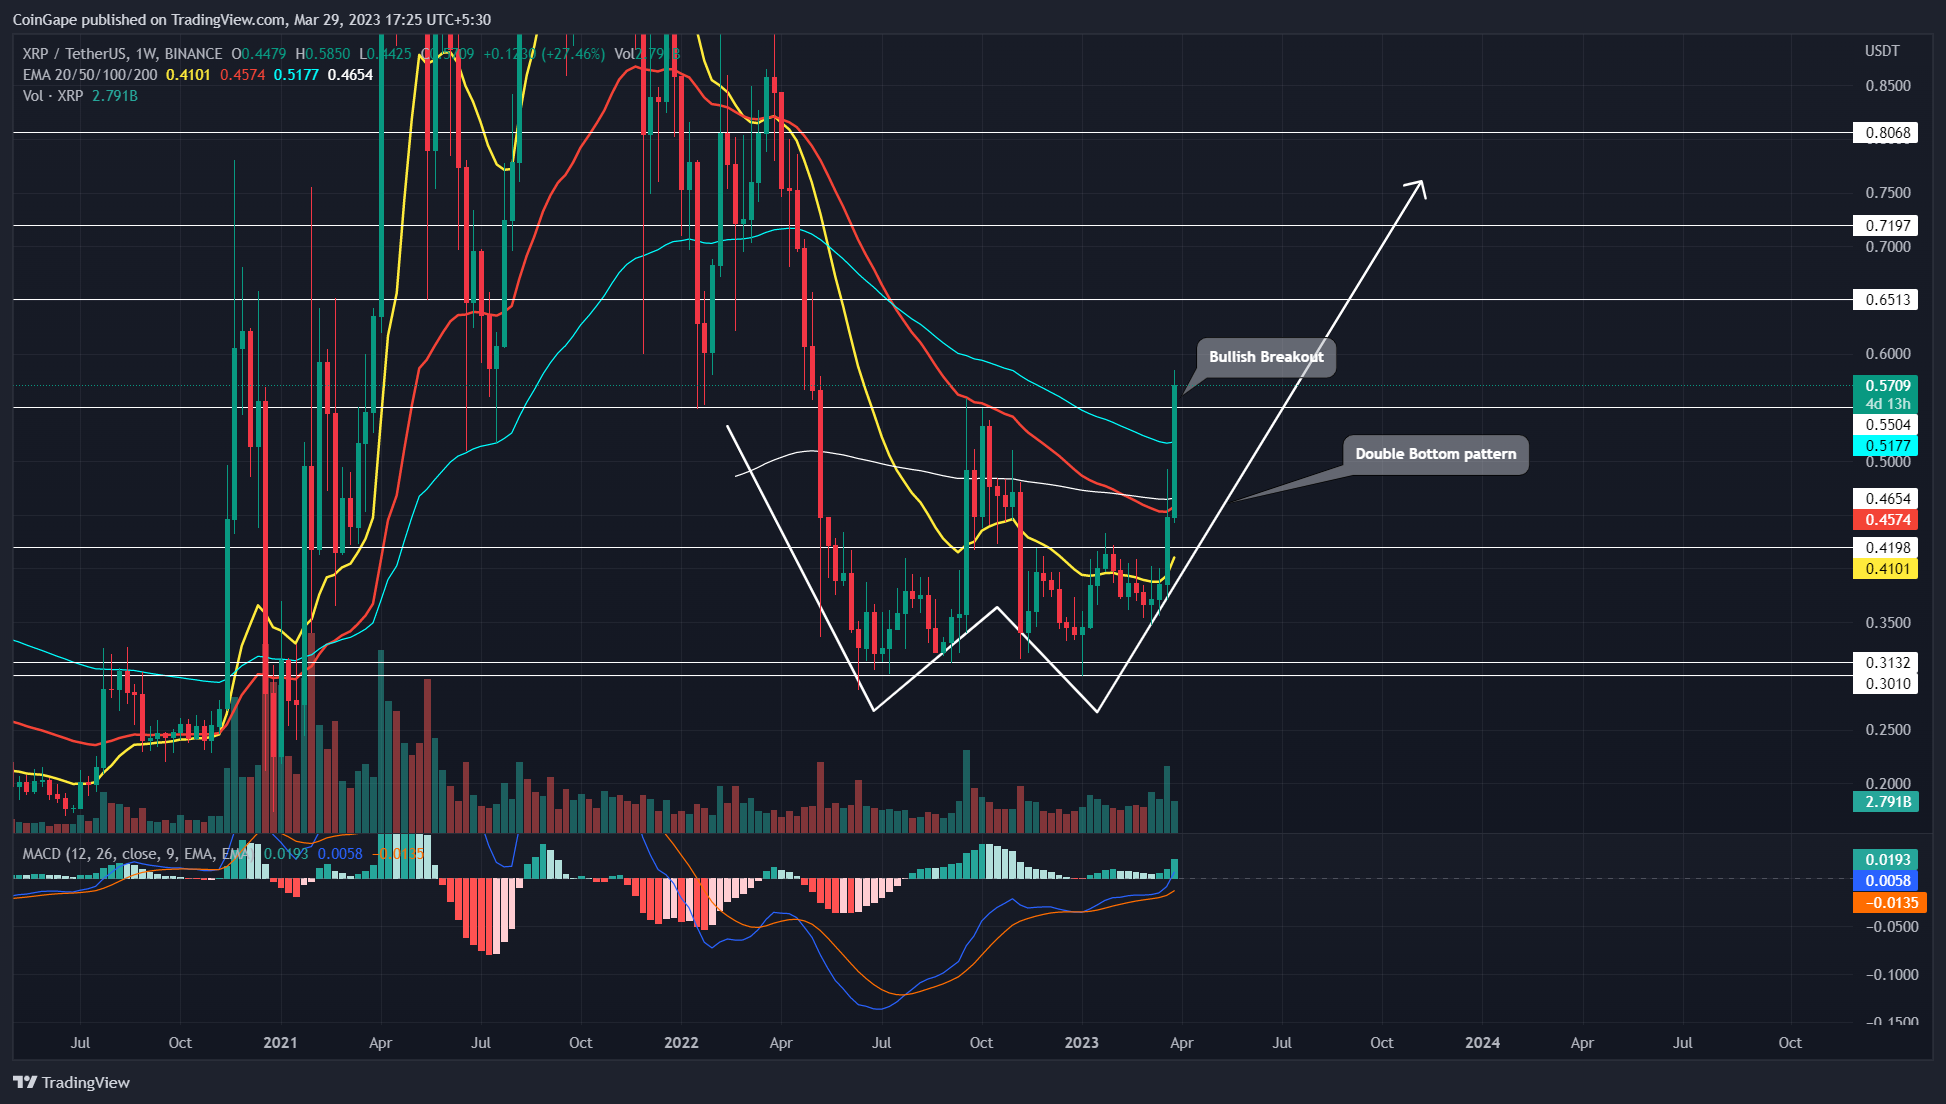
XRP Price Prediction: The XRP price neglects the indecisive market sentiment among the majority of major cryptocurrencies and showed significant growth since the start of this month. The weekly chart has shown four consecutive green candles which pushed the coin’s market 62% higher to reach the current price of the $0.572 mark. Moreover, the bullish rally has recently breached the neckline resistance of a ten-month-long bullish pattern, indicating there’s more to the ongoing recovery rally.
Key Points:
- The last ten months’ consolidation in XRP price revealed the formation of a double-bottom pattern
- A bullish breakout from the $0.55 resistance set the XRP price for a potential 40% rally
- The intraday trading volume in the XRP is $4.04 Billion, indicating a 28% gain.
Source- Tradingview
In the weekly time frame chart, the XRP price displays an evident formation of a double bottom pattern. Under the influence of the pattern, the coin price rebounded twice from the same horizontal support($0.3), creating a W-shaped structure.
Trending Stories
These two reversals suggest the buyers are aggressively accumulating at lower levels, reflecting signs of a bottom formation. Thus, with the increasing whale activity, the XRP price has shown significant growth in March and challenged a long-coming monthly resistance of $0.55
Today, the XRP price rose 11.3% and gave a massive breakout from the $0.55 neckline resistance of the double bottom pattern. If the daily candle closes above the neckline the buyers will obtain crucial support to bolster further growth potential.
Also Read: XRP Gains While Top Cryptos Bleed; Ripple Lawsuit Ruling Coming In?
In ideal bullish conditions, the completion of this pattern offers a potential target of the same length between the neckline and base support, shot from the breakout point.
Thus, the XRP price is more likely to carry a bullish rally to the $0.8 mark but could face in-between hurdles at $0.65 and $0.72 levels.
Technical Indicator
Moving Average Convergence Divergence: A steady rise in MACD(blue) and signal(orange) slope indicates sustained growth in the XRP coin price. Moreover, the interest buyers will get an additional buy signal once these lines surpass the indicator’s midline
EMAs: the bullish rally reclaimed the weekly EMAs(20, 50, 100, and 200) reflecting an early sign of trend reversal
XRP Intraday Price Levels
- Spot price: $0.568
- Trend: Bullish
- Volatility: Low
- Resistance level- $0.65 and $0.72
- Support level- $0.55 and $0.42
Share this article on:
advertisement
The presented content may include the personal opinion of the author and is subject to market condition. Do your market research before investing in cryptocurrencies. The author or the publication does not hold any responsibility for your personal financial loss.
<!– Close Story–>
- SEO Powered Content & PR Distribution. Get Amplified Today.
- Platoblockchain. Web3 Metaverse Intelligence. Knowledge Amplified. Access Here.
- Source: https://coingape.com/markets/xrp-price-poised-for-recovery-as-it-triggers-a-bullish-pattern/
- :is
- 1
- 10
- 100
- 11
- 39
- 7
- 8
- 9
- a
- above
- activity
- Ad
- Additional
- among
- and
- ARE
- article
- AS
- At
- author
- avatar
- average
- banner
- base
- Beauty
- before
- between
- Billion
- blockchain
- Blue
- bolster
- Bottom
- breakout
- Brian
- Bullish
- buy
- buyers
- carry
- challenged
- Chart
- Closes
- Coin
- Coingape
- COM
- coming
- completion
- condition
- conditions
- consecutive
- consolidation
- content
- Convergence
- could
- Creating
- crucial
- cryptocurrencies
- cryptocurrency
- cryptos
- Current
- daily
- different
- displays
- Divergence
- double
- double bottom
- Early
- Entertainment
- Ether (ETH)
- Face
- Fashion
- finance
- financial
- follow
- For
- formation
- FRAME
- from
- further
- Gain
- Gains
- get
- Green
- Growth
- growth potential
- Have
- higher
- hold
- Horizontal
- HTTPS
- Hurdles
- i
- ideal
- in
- include
- Including
- increasing
- indicates
- indicating
- influence
- interest
- investing
- IT
- journalism
- jpg
- Last
- lawsuit
- Length
- levels
- likely
- lines
- loss
- major
- Majority
- March
- mark
- Market
- market research
- market sentiment
- massive
- Month
- monthly
- more
- Moreover
- obtain
- of
- Offers
- on
- ongoing
- Opinion
- Orange
- past
- Pattern
- personal
- plato
- Plato Data Intelligence
- PlatoData
- plugin
- Point
- points
- potential
- prediction
- presented
- price
- Price Prediction
- Publication
- pushed
- rally
- reach
- Read
- recently
- recovery
- research
- Resistance
- responsibility
- Revealed
- Ripple
- ripple lawsuit
- Rise
- ROSE
- ruling
- same
- seconds
- sentiment
- set
- Share
- shown
- sign
- Signal
- significant
- Signs
- since
- Slope
- start
- steady
- structure
- subject
- support
- surpass
- Target
- ten
- The
- The Weekly
- These
- time
- to
- top
- Topics
- Trading
- trading volume
- TradingView
- Trend
- trending
- Twice
- under
- variety
- volume
- weekly
- Whale
- which
- while
- will
- with
- working
- written
- xrp
- xrp coin
- XRP Price
- XRP price prediction
- years
- Your
- zephyrnet