
Published 52 mins ago
MATIC Price Prediction: In the weekly time frame chart, the Polygon coin shows its prices have been respecting two rising trendlines which reveals the formation of a broadening channel pattern. The most common outcome of this pattern is it triggers a significant downfall upon the breakdown of its support trendline. However, there are other criteria the traders must consider before entering the coin under the influence of this channel pattern.
advertisement
Key Points
- In theory, the increasing gap between the channel’s trendline reflects the increasing indecisiveness and uncertainty among participants.
- Multiple support level accumulated at $1 support indicates a higher possibility for an upcoming bullish reversal
- The intraday trading volume in the MATIC is $318.5 Million, indicating a 15% loss.
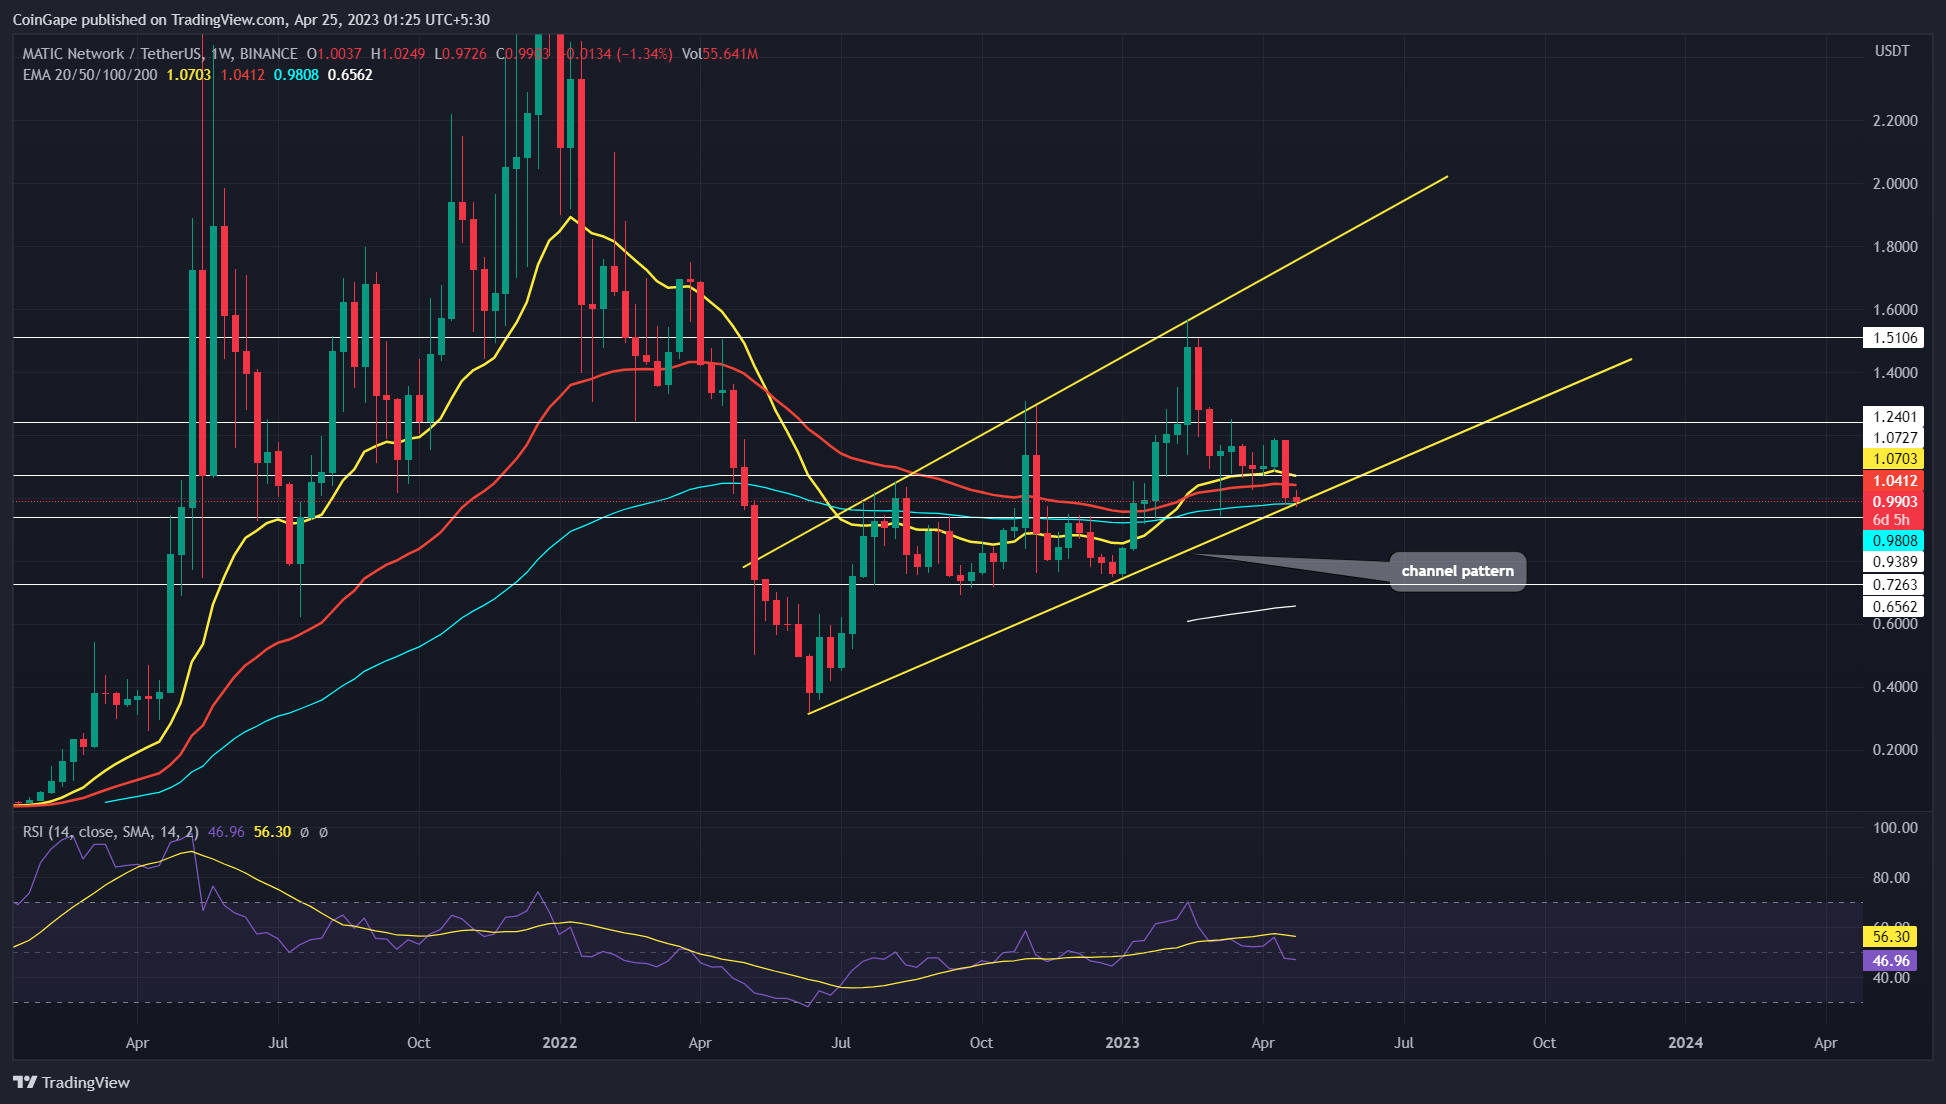
Source-Tradingview
Amid the recent sell-off in the crypto market, the MATIC price has plunged back to the channel pattern’s support trendline. Moreover, along with the trendline at $1 psychological support, this level is also near the 50% Fibonacci retracement level and 100-day EMA slope.
These accumulated supports create a strong launchpad for coin buyers to sustain at a higher price. If buyers manage to hold above the rising trendline, the prices are likely to witness a bullish reversal and trigger a bull cycle within the pattern.
Trending Stories
Also Read: 15 New Cryptocurrencies In Upcoming Binance Listing For 2023
A possible target for this reversal could be the last swing high of $1.5, indicating a potential target of 50%.
Anyhow the ongoing bullish rally will prolong until the pattern’s support trendline is intact, as a breakdown below it will invalidate the bullish thesis and signal the resumption of the prior downtrend.
Technical Indicators
Exponential Moving Average: with the recent downfall, the MATIC price dipped below the 20-and-50 EMAs after two months.
RSI: The daily RSI slope nosedived below the midline indicating the rising negative sentiment among market participants.
MATIC Coin Price Intraday Levels
- Spot rate: $0.99
- Trend: Bearish
- Volatility: Low
- Resistance levels- $1.07 and $1.24
- Support levels- $1 and $0.94
Share this article on:
advertisement
The presented content may include the personal opinion of the author and is subject to market condition. Do your market research before investing in cryptocurrencies. The author or the publication does not hold any responsibility for your personal financial loss.
- SEO Powered Content & PR Distribution. Get Amplified Today.
- Platoblockchain. Web3 Metaverse Intelligence. Knowledge Amplified. Access Here.
- Minting the Future w Adryenn Ashley. Access Here.
- Source: https://coingape.com/markets/matic-price-prediction-polygon-price-at-crucial-support-plots-a-50-rally-enter-today/
- :has
- :is
- :not
- 1
- 10
- 15%
- 20
- 7
- 8
- 9
- a
- above
- Accumulated
- Ad
- After
- along
- also
- among
- an
- and
- any
- ARE
- article
- AS
- At
- author
- avatar
- average
- back
- banner
- BE
- Beauty
- been
- before
- below
- between
- binance
- blockchain
- Breakdown
- Brian
- bull
- Bullish
- buyers
- Channel
- Chart
- Coin
- Coingape
- COM
- Common
- condition
- Consider
- content
- could
- create
- criteria
- crucial
- crypto
- Crypto Market
- cryptocurrencies
- cryptocurrency
- cycle
- daily
- different
- do
- downfall
- EMA
- Enter
- Entertainment
- Ether (ETH)
- Fashion
- Fibonacci
- finance
- financial
- follow
- For
- formation
- FRAME
- from
- gap
- Have
- High
- higher
- hold
- However
- HTTPS
- i
- in
- include
- Including
- increasing
- indicates
- indicating
- influence
- investing
- IT
- ITS
- journalism
- jpg
- Last
- Launchpad
- Level
- likely
- listing
- loss
- manage
- Market
- market research
- Matic
- MATIC price
- May..
- million
- months
- Moreover
- most
- moving
- moving average
- Near
- negative
- New
- of
- on
- ongoing
- Opinion
- or
- Other
- Outcome
- participants
- past
- Pattern
- personal
- plato
- Plato Data Intelligence
- PlatoData
- plugin
- Polygon
- Polygon Price
- possibility
- possible
- potential
- prediction
- presented
- price
- Price Prediction
- Prices
- Prior
- Publication
- rally
- Rate
- reach
- Read
- recent
- reflects
- research
- respecting
- responsibility
- retracement
- Reveals
- Reversal
- rising
- sell-off
- sentiment
- Share
- Shows
- Signal
- significant
- Slope
- strong
- subject
- support
- support level
- Supports
- Swing
- Target
- The
- The Weekly
- There.
- this
- time
- to
- today
- Topics
- Traders
- Trading
- trading volume
- TradingView
- trending
- trigger
- Uncertainty
- under
- upcoming
- variety
- volume
- weekly
- which
- will
- with
- within
- witness
- working
- written
- years
- Your
- zephyrnet