Published 6 hours ago
Over the past two weeks, the XRP price has been moving sideways between $0.44 and $0.485. The daily chart showed multiple short-body candles with long wicks indicating indecisiveness among market participants. The coin price trading at $0.46 with an insignificant significant loss of 0.02% reflects no sign of conviction from buyers or sellers. However, here is the crucial level in the technical chart that can assist the XRP price to trigger a significant rally.
advertisement
Key Points:
- Amid the ongoing downfall, the decreasing volume activity indicates the correction phase is temporary.
- A breakout above the overhead resistance trendline will signal an uptrend resumption.
- The intraday trading volume in the XRP is $730.5 Million, indicating a 2.22% loss.
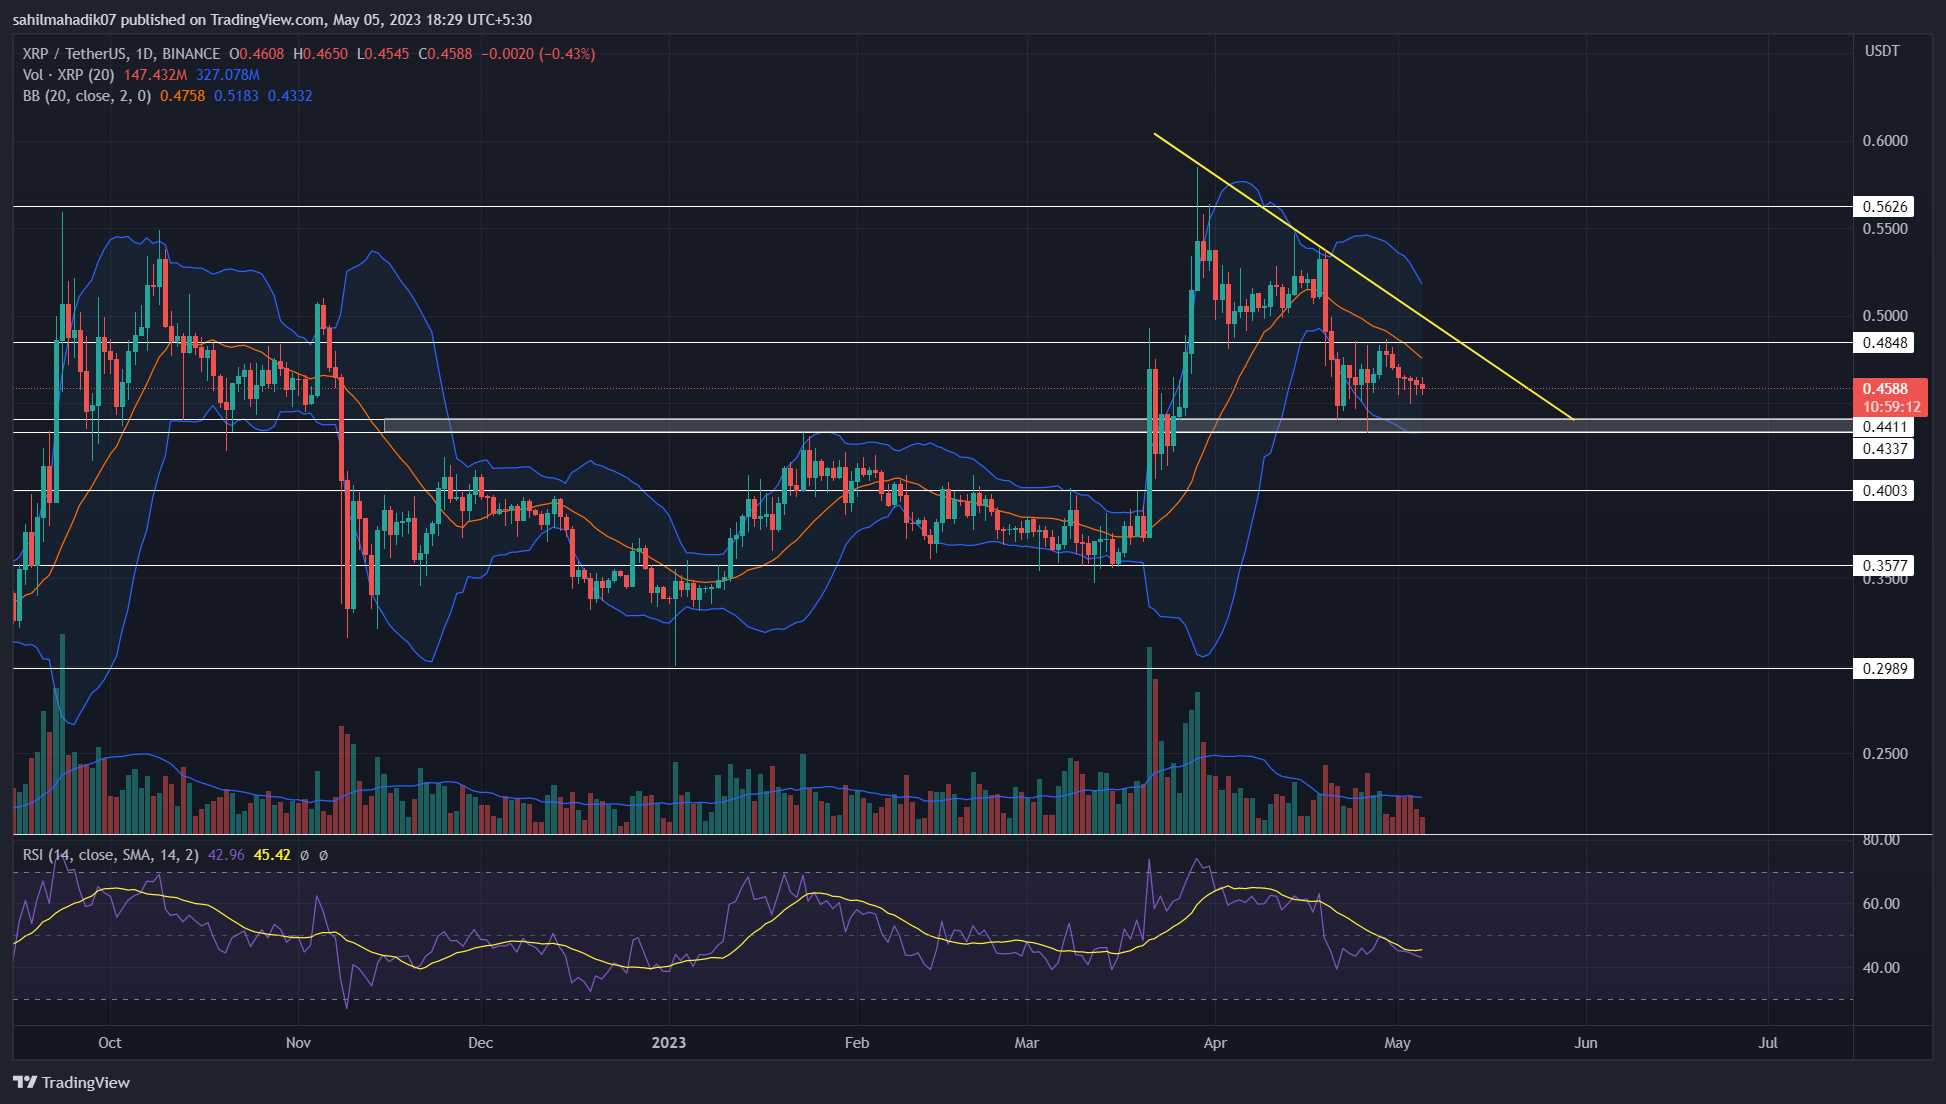
Source- Tradingview
Amid the ongoing uncertainty, the XRP price strictly responds to two technical levels which are $0.44 support and a downsloping trendline.
The $0.44 support aligned with the 50% Fibonacci retracement level forms a strong support zone for buyers to reaccumulate this altcoin. Moreover, the retracement to the 0.5 FIB is considered healthy for an overall uptrend.
Trending Stories
On the other side, the downsloping is carrying the ongoing correction phase in the XRP price. The coin price turned down from this overhead trendline twice indicating the sellers are recuperating the supply pressure at this resistance.
Also Read: Top 10 Crypto Margin Trading Platforms In Australia
Thus, until the two aforementioned levels are intact the XRP price may remain in a no-trading zone.
In case the XRP price breaks the $0.44 support, the coin holders may witness an extended downfall to the $0.4 psychological level.
On a contrary note, a breakout above the trendline will signal the end of the correction phase.
Technical Indicator
Bollinger Band: The XRP price trading below the midline and lower band of the Bollinger band indicator projects the market trend is currently under the seller’s control
Relative Strength Index: A downtick in the daily RSI slope reflects selling momentum is strong.
XRP Intraday Price Levels
- Spot price: $0.45
- Trend: Sideways
- Volatility: High
- Resistance level- $0.485 and $0.56
- Support level- $0.44 and $0.4
Share this article on:
advertisement
The presented content may include the personal opinion of the author and is subject to market condition. Do your market research before investing in cryptocurrencies. The author or the publication does not hold any responsibility for your personal financial loss.
<!– Close Story–>
- SEO Powered Content & PR Distribution. Get Amplified Today.
- PlatoAiStream. Web3 Data Intelligence. Knowledge Amplified. Access Here.
- Minting the Future w Adryenn Ashley. Access Here.
- Buy and Sell Shares in PRE-IPO Companies with PREIPO®. Access Here.
- Source: https://coingape.com/markets/xrp-price-to-prolong-sideways-trend-as-market-uncertainty-rises-is-it-a-good-time-to-buy/
- :has
- :is
- :not
- 1
- 10
- 12
- 14
- 20
- 7
- 8
- 9
- a
- above
- activity
- Ad
- ago
- aligned
- Altcoin
- am
- among
- an
- and
- any
- ARE
- article
- AS
- assist
- At
- author
- avatar
- BAND
- banner
- Beauty
- been
- before
- below
- between
- blockchain
- breakout
- breaks
- Brian
- buy
- buyers
- CAN
- Candles
- carrying
- case
- Chart
- Coin
- Coingape
- COM
- condition
- considered
- content
- contrary
- conviction
- correction phase
- crucial
- crypto
- cryptocurrencies
- cryptocurrency
- Currently
- daily
- different
- do
- does
- down
- downfall
- end
- Entertainment
- Ether (ETH)
- Fashion
- finance
- financial
- follow
- For
- forms
- from
- good
- Have
- healthy
- here
- hold
- holders
- HOURS
- However
- HTTPS
- i
- in
- include
- Including
- index
- indicates
- indicating
- investing
- IT
- journalism
- jpg
- Last
- lawsuit
- Level
- levels
- Long
- loss
- Margin
- margin trading
- Market
- market research
- May..
- million
- Momentum
- Moreover
- moving
- multiple
- news
- no
- of
- on
- ongoing
- Opinion
- or
- Other
- out
- overall
- participants
- past
- personal
- phase
- Platforms
- plato
- Plato Data Intelligence
- PlatoData
- plugin
- points
- presented
- pressure
- price
- projects
- Publication
- rally
- reach
- Read
- reflects
- remain
- research
- Resistance
- responsibility
- retracement
- Ripple
- ripple lawsuit
- Rises
- Sellers
- Selling
- Share
- side
- sideways
- sign
- Signal
- significant
- strength
- strong
- subject
- supply
- support
- Technical
- temporary
- that
- The
- this
- time
- time to buy
- to
- Topics
- Trading
- Trading Platforms
- trading volume
- TradingView
- Trend
- trending
- trigger
- Turned
- Twice
- two
- Uncertainty
- under
- until
- uptrend
- variety
- volume
- Weeks
- which
- will
- with
- witness
- working
- written
- xrp
- XRP Price
- years
- Your
- zephyrnet