- Inflation in Australia fell sharply in November.
- Consumer inflation in the US came in higher than expected.
- Data showed a drop in US producer inflation.
Anticipate a downward trajectory in the AUD/USD weekly forecast as Australia’s inflation data solidifies the RBA’s newly adopted dovish stance. Meanwhile, across the Pacific, the US reported higher-than-expected consumer inflation, setting the stage for more downside in the pair.
–Are you interested to learn more about forex options trading? Check our detailed guide-
Ups and downs of AUD/USD
The pair had a bearish week shaped by inflation figures from the US and Australia. Inflation in Australia fell sharply in November, strengthening the view that the RBA is done with rate hikes. Consequently, investors are still expecting 50 bps of easing in 2024.
Meanwhile, the US had a mix in the inflation data. Consumer inflation came in higher than expected. As a result, investors scaled back bets on Fed rate cuts. Meanwhile, on Friday, data showed a drop in US producer inflation. However, after all this, investors are still expecting rate cuts in the US to start in March.
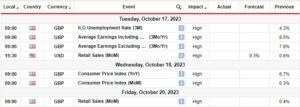
Next week’s key events for AUD/USD
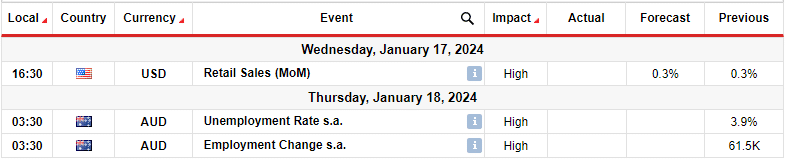
Next week, traders will monitor the US retail sales and employment reports from Australia. Australia’s labor market remains tight. Notably, job vacancies in Australia saw a minor decline in the three months leading to the end of November. This indicates that worker demand remains robust despite a slight overall easing in the labor market.
Still, the slight easing in the market has contributed to slower wage growth. Consequently, there is less pressure on the Reserve Bank of Australia to consider another interest rate hike. Therefore, if the labor market continues easing, it will strengthen the RBA’s bearish stance.
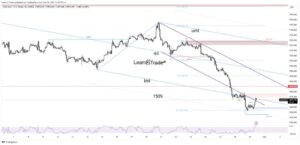
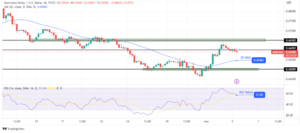
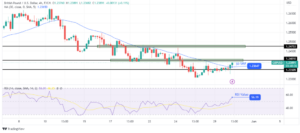
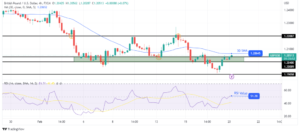
AUD/USD weekly technical forecast: Bears take the lead, breaking 22-SMA barrier
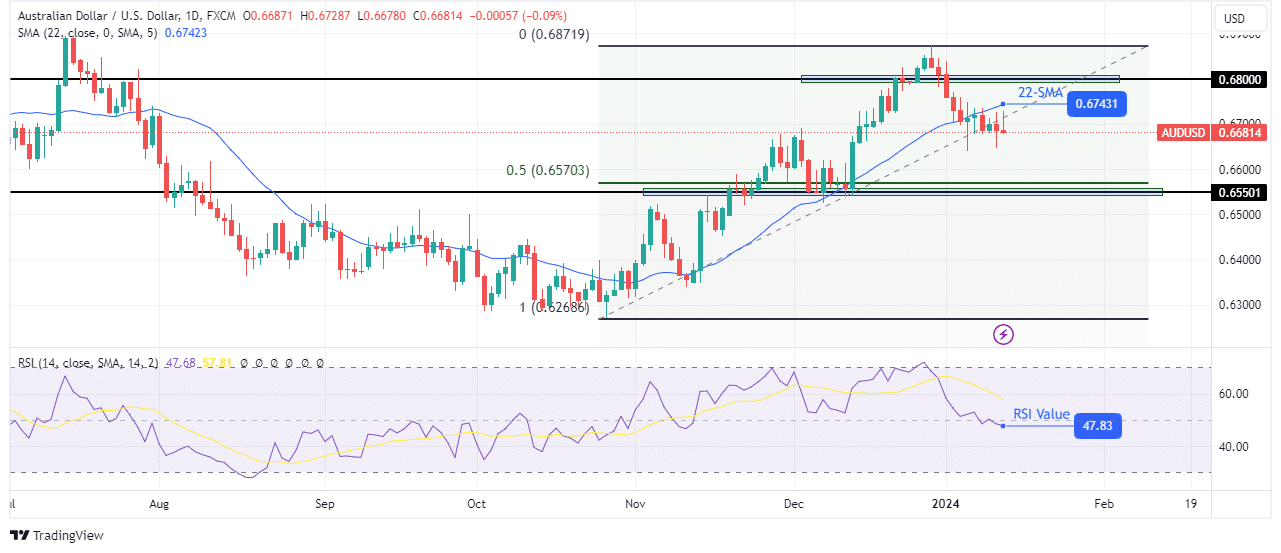
On the technical side, AUD/USD has broken below the 22-SMA, a sign that bears are challenging the bullish trend. At the same time, the RSI has dipped into bearish territory below 50, signaling a shift in sentiment.
–Are you interested to learn about forex robots? Check our detailed guide-
The previous bullish trend was strong, with the price making higher highs and lows above the 22-SMA support. However, bulls could not sustain a move above the 0.6800 key resistance level. At this point, bears took over, sending the price below the 22-SMA.
Consequently, AUD/USD might drop further next week to reach the 0.6550 support level. This level is also near the 0.5 Fib retracement level, making a strong support zone.
Looking to trade forex now? Invest at eToro!
67% of retail investor accounts lose money when trading CFDs with this provider. You should consider whether you can afford to take the high risk of losing your money.
- SEO Powered Content & PR Distribution. Get Amplified Today.
- PlatoData.Network Vertical Generative Ai. Empower Yourself. Access Here.
- PlatoAiStream. Web3 Intelligence. Knowledge Amplified. Access Here.
- PlatoESG. Carbon, CleanTech, Energy, Environment, Solar, Waste Management. Access Here.
- PlatoHealth. Biotech and Clinical Trials Intelligence. Access Here.
- Source: https://www.forexcrunch.com/blog/2024/01/13/aud-usd-weekly-forecast-aus-inflation-signals-dovish-rba/
- :has
- :is
- :not
- 1
- 160
- 2024
- 50
- a
- About
- above
- Accounts
- across
- adopted
- After
- All
- also
- and
- Another
- ARE
- AS
- At
- AUD/USD
- Australia
- back
- Bank
- bearish
- Bears
- below
- Bets
- Breaking
- Broken
- Bullish
- Bulls
- by
- came
- CAN
- CFDs
- challenging
- check
- Consequently
- Consider
- consumer
- continues
- contributed
- could
- cuts
- daily
- data
- Decline
- Demand
- Despite
- detailed
- done
- Dovish
- downs
- downside
- downward
- Drop
- easing
- employment
- end
- events
- expected
- expecting
- Fed
- Figures
- For
- Forecast
- forex
- Friday
- from
- further
- Growth
- had
- High
- higher
- Highs
- Hike
- Hikes
- However
- HTTPS
- if
- in
- indicates
- inflation
- inflation figures
- interest
- INTEREST RATE
- interest rate hike
- interested
- into
- Invest
- investor
- Investors
- IT
- Job
- Key
- key resistance
- labor
- labor market
- lead
- leading
- LEARN
- less
- Level
- lose
- losing
- Lows
- Making
- March
- Market
- max-width
- Meanwhile
- might
- minor
- mix
- money
- Monitor
- months
- more
- move
- Near
- newly
- next
- next week
- notably
- November
- now
- of
- on
- Options
- our
- over
- overall
- Pacific
- pair
- plato
- Plato Data Intelligence
- PlatoData
- Point
- pressure
- previous
- price
- producer
- provider
- Rate
- Rate Hike
- rate hikes
- RBA
- reach
- remains
- Reported
- Reports
- Reserve
- reserve bank
- reserve bank of australia
- Resistance
- result
- retail
- Retail Sales
- retracement
- Risk
- robust
- rsi
- sales
- same
- saw
- sending
- sentiment
- setting
- shaped
- shift
- should
- showed
- side
- sign
- signals
- solidifies
- Stage
- stance
- start
- Still
- Strengthen
- strengthening
- strong
- support
- support level
- Take
- Technical
- territory
- than
- that
- The
- There.
- therefore
- this
- three
- time
- to
- took
- trade
- Traders
- Trading
- trajectory
- Trend
- us
- US Retail Sales
- View
- wage
- was
- week
- weekly
- when
- whether
- will
- with
- worker
- you
- Your
- zephyrnet