- The NZD/USD caught some much-needed lift on Thursday after setting a new eleven-month low.
- NZ’s Roy Morgan Consumer Confidence for October improved slightly.
- Markets are turning towards Friday’s US PCE Index release to close out the trading week.
The NZD/USD set a fresh low of 0.5772 for 2023, the pair’s lowest bid since November of last year. After chalking in a new yearly low, the Kiwi (NZD) caught a much-needed rebound and heads into the Friday Asia market session trading near 0.5820.
US Gross Domestic Product (GDP) figures broadly beat market estimates, printing at 4.9% for the 3rd quarter compared to the previous reading of 2.1%, soundly thumping the market estimates of 4.2%.
Forex Today: Dollar stays cool despite hot US economy
Despite the bumper US data read, the US Dollar (USD) gave up some ground against the NZD after etching in a new high against the Antipodean.
New Zealand Consumer Confidence for October increased slightly, helping to give some minor intraday lift to the Kiwi, with the Roy Morgan sentiment measure coming in at 88.1 compared to September’s 86.4.
The broader market now turns towards Friday’s US Personal Consumption Expenditure (PCE) Price Index reading for September. The PCE Index, as the Federal Reserve’s favored measure of inflation, will be closely watched by traders hoping for signs that the Fed will be pushed into a rate-cut cycle sooner rather than later.
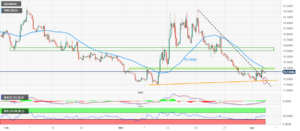
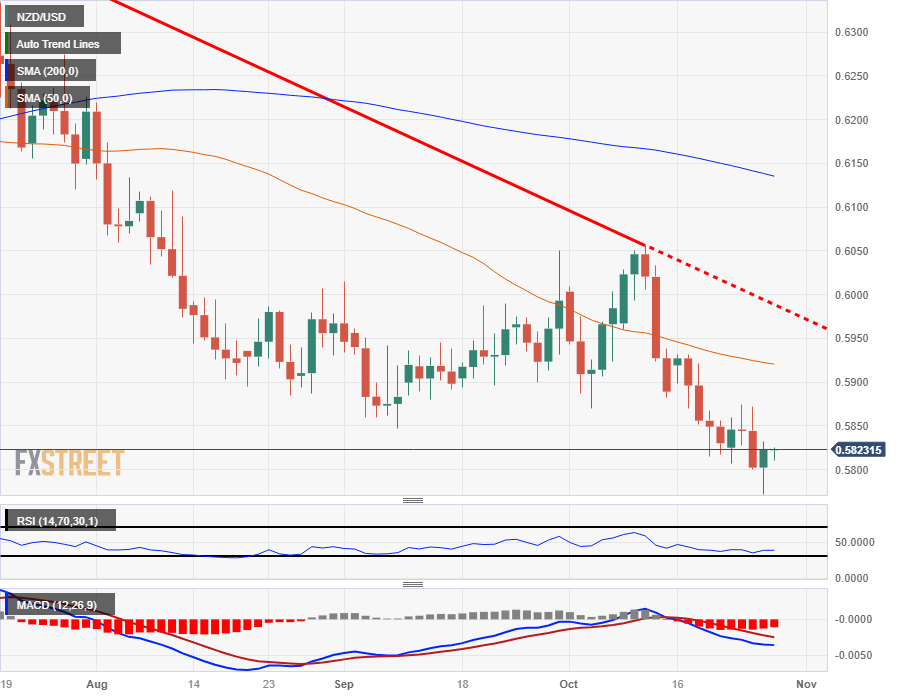
NZD/USD Technical Outlook
With the NZD/USD trading into eleven-month lows, the way below is primed for the Kiwi to face off against swing lows from back in November of 2022, near 0.5740.
Technical resistance is mounting on the NZD/USD with the 50-day Simple Moving Average (SMA) dropping into 0.5925 and the last significant swing high sitting near 0.6050.
On the bullish side, the Relative Strength Index (RSI) is testing close to the oversold barrier, indicating there could be buying opportunities from extreme lows, though indicator traders may want to wait for a fast-line bullish crossover on the Moving Average Convergence-Divergence (MCAD) oscillator.
NZD/USD Daily Chart
NZD/USD Technical Levels
- SEO Powered Content & PR Distribution. Get Amplified Today.
- PlatoData.Network Vertical Generative Ai. Empower Yourself. Access Here.
- PlatoAiStream. Web3 Intelligence. Knowledge Amplified. Access Here.
- PlatoESG. Carbon, CleanTech, Energy, Environment, Solar, Waste Management. Access Here.
- PlatoHealth. Biotech and Clinical Trials Intelligence. Access Here.
- Source: https://www.fxstreet.com/news/nzd-usd-sets-a-new-low-for-2023-of-05772-before-seeing-a-soft-rebound-202310262244
- :is
- $UP
- 1
- 2%
- 2022
- 2023
- 3rd
- a
- After
- against
- and
- ARE
- AS
- asia
- At
- average
- back
- barrier
- BE
- beat
- before
- below
- broader
- broadly
- Bullish
- Buying
- by
- caught
- Close
- closely
- coming
- compared
- confidence
- consumer
- consumption
- Cool
- could
- cycle
- daily
- data
- Despite
- Dollar
- Domestic
- Dropping
- estimates
- extreme
- Face
- Fed
- Federal
- federal reserve
- Figures
- For
- fresh
- Friday
- from
- gave
- GDP
- Give
- gross
- Ground
- heads
- helping
- High
- hoping
- HOT
- HTTPS
- improved
- in
- increased
- index
- indicating
- Indicator
- inflation
- into
- Last
- Last Year
- later
- Low
- lowest
- Lows
- Market
- May..
- measure
- minor
- Morgan
- moving
- moving average
- much-needed
- Near
- New
- November
- now
- NZD
- NZD/USD
- october
- of
- off
- on
- opportunities
- out
- pair
- pce
- personal
- plato
- Plato Data Intelligence
- PlatoData
- previous
- price
- printing
- Product
- pushed
- Quarter
- rather
- Read
- Reading
- rebound
- relative
- relative strength index
- Relative Strength Index (RSI)
- release
- Reserve
- Resistance
- roy
- rsi
- s
- seeing
- sentiment
- September
- session
- set
- Sets
- setting
- side
- significant
- Signs
- Simple
- since
- Sitting
- SMA
- Soft
- some
- strength
- Swing
- Technical
- Testing
- than
- that
- The
- the Fed
- There.
- though?
- thursday
- to
- today
- towards
- Traders
- Trading
- Turning
- turns
- us
- USD
- wait
- want
- Way..
- week
- will
- with
- year
- yearly
- Zealand
- zephyrnet