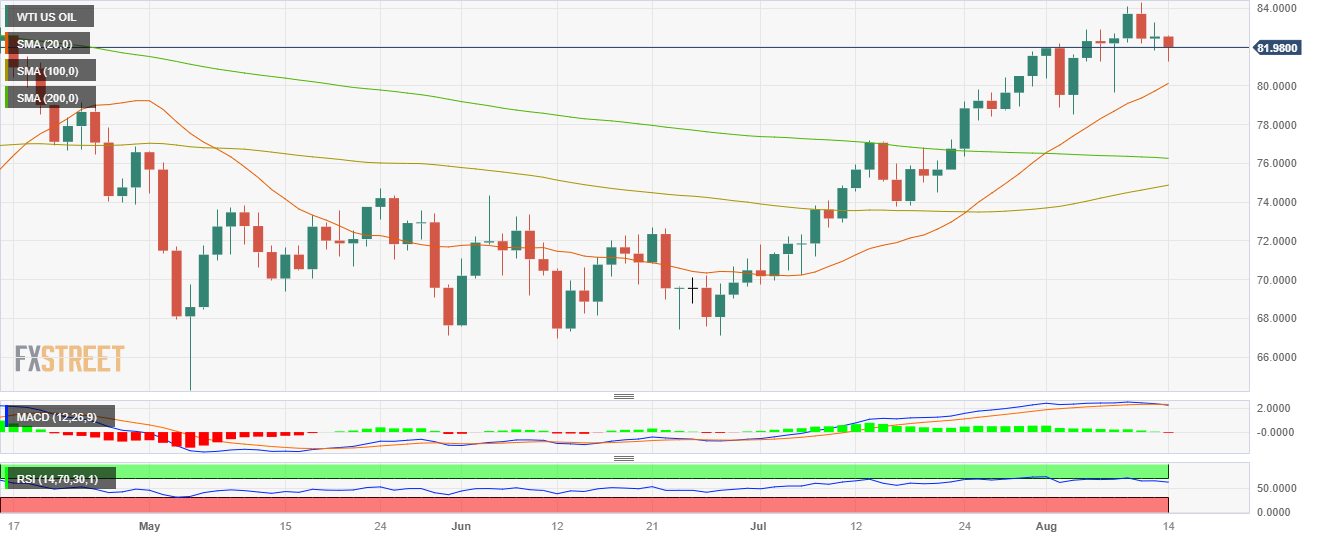
- WTI fell below $83.00 and reached a daily low of $81.30 during the American session.
- County Garden Holdings, a Chinese real-state giant, announced that it would suspend part of its bond trading.
- A stronger USD also weighs on Oil prices.
At the start of the week, the West Texas Intermediate (WTI) barrel lost traction, fell to a daily low of $81.30, and settled near $82.00. A stronger USD on the back of higher US yields and Chinese real-state sector concerns are mainly responsible for the Oil’s downward trajectory.
China’s major real estate firm, Country Garden Holdings, revealed a projected loss of $7.6 billion for H1 2023 and announced that it would halt trading 11 onshore bonds starting Monday. This caused a nearly 20% drop in their shares, bringing down the Shangai Composite Index. In addition, Moody’s warned of a potential crisis spillover to the country’s property and financial markets, possibly delaying the sector’s recovery. It’s worth mentioning that China is the largest Oil importer in the world, so the weakness of the real-estate industry, an important gauge of an economy’s health, weighs on the WTI’s price.
On the other hand, the USD, measured by the DXY index, rose above 103.00, and the Greenback gained interest in higher US yields. In that sense, the bond markets are flashing signals that investors are confident that the Federal Reserve (Fed) won’t hike in September but that the odds of a 25 basis point increase in November have risen to nearly 40%, according to the CME FedWatch tool. In that sense, higher rates which tend to cool down economic activity, present another challenge to Oil prices.
WTI Levels to watch
The technical analysis of the daily chart suggests a shift towards a neutral to a bearish outlook for WTI, with indications of bullish exhaustion. The Relative Strength Index (RSI) exhibits a negative slope above its midline, while the Moving Average Convergence Divergence (MACD) displays fading green bars. That being said, the pair is above the 20,100,200-day Simple Moving Averages (SMAs), indicating a favourable position for the bulls in the bigger picture.
Support levels: $81.30, $81.00, $79.50.
Resistance levels: $83.70, $84.00, $85.00
WTI Daily chart

- SEO Powered Content & PR Distribution. Get Amplified Today.
- PlatoData.Network Vertical Generative Ai. Empower Yourself. Access Here.
- PlatoAiStream. Web3 Intelligence. Knowledge Amplified. Access Here.
- PlatoESG. Automotive / EVs, Carbon, CleanTech, Energy, Environment, Solar, Waste Management. Access Here.
- PlatoHealth. Biotech and Clinical Trials Intelligence. Access Here.
- ChartPrime. Elevate your Trading Game with ChartPrime. Access Here.
- BlockOffsets. Modernizing Environmental Offset Ownership. Access Here.
- Source: https://www.fxstreet.com/news/wti-price-analysis-wti-drops-amid-chinese-real-state-sector-fears-202308142052
- :is
- 100
- 11
- 20
- 2023
- 25
- 30
- 50
- 70
- a
- above
- According
- activity
- addition
- also
- American
- Amid
- an
- analysis
- and
- announced
- Another
- ARE
- average
- back
- bars
- basis
- basis point
- bearish
- being
- below
- bigger
- Billion
- bond
- Bond Markets
- Bonds
- Bringing
- Bullish
- Bulls
- but
- by
- caused
- challenge
- Chart
- China
- chinese
- CME
- Concerns
- confident
- Convergence
- Cool
- country
- crisis
- daily
- displays
- Divergence
- down
- downward
- Drop
- Drops
- during
- Dxy
- Economic
- economy’s
- estate
- exhibits
- fears
- Fed
- Federal
- federal reserve
- financial
- Firm
- flashing
- For
- gained
- Garden
- gauge
- giant
- Green
- Greenback
- hand
- Have
- Health
- higher
- Hike
- Holdings
- HTTPS
- important
- in
- Increase
- index
- indicating
- indications
- industry
- interest
- Intermediate
- Investors
- IT
- ITS
- largest
- levels
- loss
- lost
- Low
- MACD
- mainly
- major
- Markets
- measured
- Monday
- moving
- moving average
- moving averages
- Near
- nearly
- nearly 20%
- negative
- Neutral
- November
- Odds
- of
- Oil
- on
- Other
- Outlook
- pair
- part
- picture
- plato
- Plato Data Intelligence
- PlatoData
- Point
- position
- possibly
- potential
- present
- price
- Price Analysis
- Prices
- projected
- property
- Rates
- reached
- real
- real estate
- recovery
- relative
- relative strength index
- Relative Strength Index (RSI)
- Reserve
- responsible
- Revealed
- Risen
- ROSE
- rsi
- s
- Said
- sector
- sense
- September
- session
- Settled
- Shares
- shift
- signals
- Simple
- Slope
- SMAs
- So
- start
- Starting
- strength
- stronger
- Suggests
- Suspend
- Technical
- Technical Analysis
- that
- The
- the world
- their
- this
- to
- tool
- towards
- traction
- Trading
- trajectory
- us
- US yields
- USD
- weakness
- week
- weighs
- which
- while
- with
- world
- worth
- would
- WTI
- yields
- zephyrnet


