- Gold treads water with the market on a wait-and-see stance ahead of the NFP report.
- The near-term trend remains intact, fuelled by heightened speculation that Fed hikes are over.
- The Dollar is drawing some support from a mild recovery in US yields.
Gold price (XAU/USD) has been moving within previous ranges during Friday’s European trading session. Investors are watching from the sidelines, awaiting the release of the Nonfarm Payrolls (NFP) report, which will clarify the Federal Reserve’s (Fed) next steps.
Earlier this week the US JOLT’s openings and the ADP employment report pictured a softening labor market, further supported by Thursday’s Weekly Jobless Claims.
In this context, another downbeat reading at Friday’s Nonfarm Payrolls report will confirm that the Fed’s tightening cycle is over and fuel market speculation of rate cuts early next year. This will push US yields and the US Dollar lower, giving a fresh impulse to the precious metal.
So far, however, the US Dollar maintains the moderate bid tone seen during most of the week as hopes of monetary easing have spread from the Fed to most of the major world’s central banks.
Beyond that, the ongoing uncertainty about China and the escalating tensions in the Middle East have provided additional support to the safe-haven Greenback.
Daily Digest Market Movers: Gold is looking for direction with all eyes on the US NFP
- Gold prices are consolidating above the $2,000 support with the market awaiting November’s US Nonfarm Payrolls report.
- The US economy is expected to have created 180K jobs in November, up from 150K in the previous month.
- Investors will also keep an eye on the wage component to assess the near-term inflation trends. Average Hourly Earnings are expected to have risen by 0.3%, and 4.0% from November last year.
- Recent employment figures revealed that the US labor market is losing momentum, which has boosted speculation about a dovish turn in the Fed’s monetary policy outlook.
- The CME group's FedWatch Tool shows a 99% chance that the Fed will stand pat at next week’s meeting and a more than a 50% possibility of a rate cut in March 2024.
- A weak NFP reading on Friday will confirm that the tightening cycle is over and ramp up bets of rate hikes in March. This is likely to push US yields and the US Dollar lower, giving a fresh boost to Gold prices.
Technical Analysis: Gold price remains biased higher with bears capped at the $ 2,000 support area
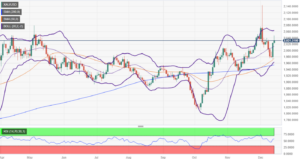
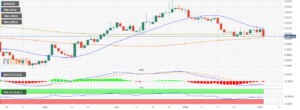
Technical indicators suggest that the precious metal maintains its longer-term bullish trend from early October lows intact, with downside attempts contained above the $2,000 support area.
The XAU/USD has been trading sideways for the fourth consecutive day on Friday, looking for direction after Monday’s reversal from all-time highs at the $2,150 area. The RSI is practically flat on intraday charts with the main SMAs on the hourly chart converging around the price action, suggesting a lack of clear direction.
Looking from a wider perspective, Bullion is showing a clear trend of higher highs and higher lows, with a key support area at the $2,010 area, where a previous peak meets the trendline support from early October lows.
On the upside, immediate resistance lies at $2,040, which is closing the way towards $2,067 and the all-time high, at $2,150.
US Dollar price today
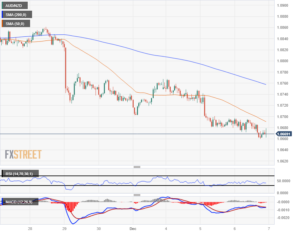
The table below shows the percentage change of US Dollar (USD) against listed major currencies today. US Dollar was the weakest against the Australian Dollar.
| USD | EUR | GBP | CAD | AUD | JPY | NZD | CHF | |
| USD | 0.07% | 0.06% | -0.13% | -0.16% | 0.09% | 0.22% | -0.08% | |
| EUR | -0.07% | -0.01% | -0.22% | -0.25% | 0.02% | 0.12% | -0.15% | |
| GBP | -0.06% | 0.00% | -0.20% | -0.24% | 0.01% | 0.14% | -0.14% | |
| CAD | 0.15% | 0.22% | 0.22% | -0.03% | 0.24% | 0.34% | 0.07% | |
| AUD | 0.16% | 0.25% | 0.25% | 0.02% | 0.25% | 0.37% | 0.11% | |
| JPY | -0.08% | 0.00% | -0.02% | -0.22% | -0.25% | 0.16% | -0.16% | |
| NZD | -0.19% | -0.14% | -0.14% | -0.32% | -0.38% | -0.13% | -0.28% | |
| CHF | 0.09% | 0.15% | 0.15% | -0.05% | -0.09% | 0.14% | 0.28% |
The heat map shows percentage changes of major currencies against each other. The base currency is picked from the left column, while the quote currency is picked from the top row. For example, if you pick the Euro from the left column and move along the horizontal line to the Japanese Yen, the percentage change displayed in the box will represent EUR (base)/JPY (quote).
Economic Indicator
United States Nonfarm Payrolls
The Nonfarm Payrolls release presents the number of new jobs created in the US during the previous month in all non-agricultural businesses; it is released by the US Bureau of Labor Statistics (BLS). The monthly changes in payrolls can be extremely volatile. The number is also subject to strong reviews, which can also trigger volatility in the Forex board. Generally speaking, a high reading is seen as bullish for the US Dollar (USD), while a low reading is seen as bearish, although previous months' reviews and the Unemployment Rate are as relevant as the headline figure. The market's reaction, therefore, depends on how the market assesses all the data contained in the BLS report as a whole.
Read more.America’s monthly jobs report is considered the most important economic indicator for forex traders. Released on the first Friday following the reported month, the change in the number of positions is closely correlated with the overall performance of the economy and is monitored by policymakers. Full employment is one of the Federal Reserve’s mandates and it considers developments in the labor market when setting its policies, thus impacting currencies. Despite several leading indicators shaping estimates, Nonfarm Payrolls tend to surprise markets and trigger substantial volatility. Actual figures beating the consensus tend to be USD bullish.
- SEO Powered Content & PR Distribution. Get Amplified Today.
- PlatoData.Network Vertical Generative Ai. Empower Yourself. Access Here.
- PlatoAiStream. Web3 Intelligence. Knowledge Amplified. Access Here.
- PlatoESG. Carbon, CleanTech, Energy, Environment, Solar, Waste Management. Access Here.
- PlatoHealth. Biotech and Clinical Trials Intelligence. Access Here.
- Source: https://www.fxstreet.com/news/gold-prices-keep-moving-sideways-on-friday-ahead-of-the-us-nonfarm-payrolls-data-202312081102
- :has
- :is
- :where
- $UP
- 000
- 1
- 10
- 11
- 12
- 125
- 13
- 14
- 150
- 16
- 17
- 2024
- 23
- 25
- 29
- 30
- 32
- 33
- 35%
- 41
- 67
- 7
- 75
- 8
- 84
- 9
- a
- About
- above
- Action
- actual
- Additional
- adp
- ADP Employment Report
- After
- against
- ahead
- All
- all-time highs
- along
- also
- Although
- an
- analysis
- and
- Animate
- Another
- ARE
- AREA
- around
- AS
- assess
- assesses
- At
- Attempts
- Australian
- Australian dollar
- average
- awaiting
- Banks
- base
- BE
- bearish
- Bears
- been
- below
- Bets
- biased
- bid
- board
- boost
- Boosted
- Box
- bullion
- Bullish
- Bureau
- businesses
- by
- CAN
- central
- Central Banks
- Chance
- change
- Changes
- Chart
- Charts
- China
- clear
- closely
- closing
- CME
- CME Group
- Column
- component
- Confirm
- consecutive
- Consensus
- considered
- considers
- consolidating
- contained
- content
- context
- converging
- correlated
- created
- currencies
- Currency
- Cut
- cuts
- cycle
- data
- day
- depends
- Despite
- developments
- Digest
- direction
- displayed
- Dollar
- Dovish
- downside
- drawing
- during
- each
- Early
- Earnings
- easing
- East
- Economic
- economy
- employment
- ends
- estimates
- EUR
- Euro
- European
- Event
- example
- expected
- extremely
- eye
- Eyes
- false
- far
- Fed
- fed hikes
- Federal
- Federal Reserve’s
- Figure
- Figures
- First
- flat
- following
- For
- forex
- Fourth
- fresh
- Friday
- from
- Fuel
- full
- further
- generally
- Giving
- Gold
- gold price
- Gold Prices
- Greenback
- Group
- Have
- headline
- heightened
- High
- higher
- Highs
- Hikes
- hopes
- Horizontal
- How
- However
- HTTPS
- if
- immediate
- impacting
- important
- in
- Indicator
- Indicators
- inflation
- Investors
- IT
- ITS
- Japanese
- Japanese Yen
- Jobs
- jobs report
- jpg
- Keep
- Key
- labor
- labor market
- Lack
- Last
- Last Year
- leading
- left
- lies
- likely
- Line
- Listed
- looking
- losing
- Low
- lower
- Lows
- Main
- maintains
- major
- mandates
- map
- March
- March 2024
- Market
- Markets
- meeting
- Meets
- metal
- Middle
- Middle East
- mild
- moderate
- module
- Momentum
- Monetary
- Monetary Policy
- monitored
- Month
- monthly
- months
- more
- most
- move
- Movers
- moving
- New
- next
- nfp
- None
- Nonfarm
- Nonfarm Payrolls
- November
- number
- october
- of
- on
- ONE
- ongoing
- openings
- Other
- Outlook
- over
- overall
- Payrolls
- Peak
- percentage
- performance
- perspective
- pick
- picked
- plato
- Plato Data Intelligence
- PlatoData
- policies
- policy
- policymakers
- positions
- possibility
- practically
- Precious
- presents
- previous
- price
- PRICE ACTION
- Prices
- provided
- Push
- quote
- Ramp
- range
- Rate
- rate hikes
- reaction
- Read
- Reading
- recovery
- release
- released
- relevant
- remain
- remains
- report
- Reported
- represent
- reserves
- Resistance
- Revealed
- Reversal
- Reviews
- Risen
- ROW
- rsi
- s
- seen
- session
- setting
- several
- shaping
- showing
- Shows
- sideways
- SMAs
- some
- speaking
- speculation
- spread
- stance
- stand
- starts
- States
- Steps
- strong
- subject
- substantial
- suggest
- support
- Supported
- surprise
- table
- tend
- tensions
- than
- that
- The
- the Fed
- therefore
- this
- this week
- Thus
- tightening
- to
- today
- TONE
- tool
- top
- towards
- Traders
- Trading
- Trend
- Trends
- trigger
- true
- TURN
- Uncertainty
- unemployment
- unemployment rate
- Upside
- us
- US Dollar
- US economy
- US nonfarm payrolls
- US nonfarm payrolls report
- US yields
- USD
- volatile
- Volatility
- wage
- was
- watching
- Water
- Way..
- week
- weekly
- when
- which
- while
- whole
- wider
- will
- with
- within
- world’s
- XAU/USD
- year
- Yen
- yields
- you
- zephyrnet