All reagents were used as received unless stated otherwise. All chemicals were purchased from Sigma Aldrich except for the counting beads (CountBright Absolute Counting Beads, Invitrogen). ζ-Potential was measured using a Zetasizer NanoZS90 (Malvern Instruments). Size and morphology of the particles was studied by SEM in a JEOL JSM 7800F Prime microscope with integrated EDS to provide the elemental analysis. Particle size was determined by measuring 50 independent particles. Radio instant thin-layer chromatography (ITLC) was developed on Agilent Technologies glass microfibre chromatography paper impregnated with silicic acid and analysed using a Lablogic Flow-count TLC scanner and a BioScan B-FC-3200 photomultiplier tube (PMT) detector using Laura software. The ITLC mobile phase was composed of 0.175 M citric acid and 0.325 M trisodium citrate in water unless stated otherwise. Radioactive samples were measured using a Capintec CRC-25R (Capintec) or an LKB Wallac 1282 Compugamma CS (PerkinElmer) for which data were collected using EdenTerm software. Flow cytometry experiments were carried out in a BD FACSMelody cell sorter using BD FACSChorus Software. PET/CT images were acquired using a NanoPET/CT scanner (Mediso), reconstructed using Nucline v.0.21 software, and images were analysed using VivoQuant software (version 3.5, InviCRO). Listmode data were obtained by a specific MATLAB software tool developed by Mediso. Autoradiography was performed in a GE Amersham Typhoon instrument.
Synthesis of sub-micrometre-size silica particles
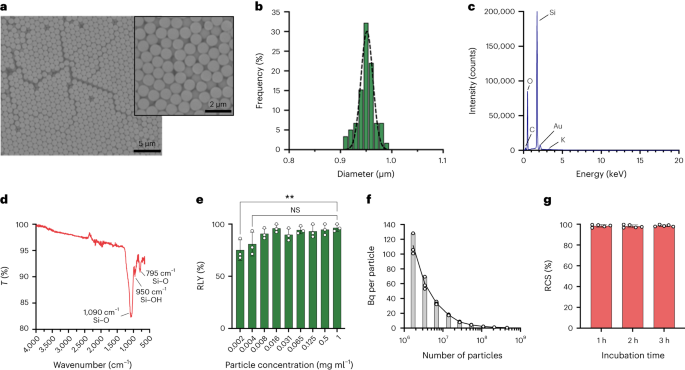
The particles were synthesized using the Stöber method. This method is based on the hydrolysis and consecutive condensation of silicon alkoxides to produce monodisperse, spherical silica particles27. Tetraethyl orthosilicate (TEOS) was used as silicon source, ammonia as base catalyst and potassium chloride as electrolyte. A solution of TEOS in ethanol was continuously added to a solution containing the catalyst and the electrolyte. Modification of the reagent starting quantity or addition rate provides differences in the particle size as previously reported28. Here, two solutions were prepared before the synthesis of the particles: Solution 1 containing 19.0 mmol of TEOS in 33.3 ml of EtOH and Solution 2 containing 0.23 mmol of KCl in 9 ml of ammonia, 65 ml of EtOH and 6.75 ml of H2O. For the synthesis, Solution 2 was placed in a 250 ml round-bottom flask heated at 50 °C under stirring at 300 rpm for 15 min. Then, Solution 1 was added dropwise to Solution 2 (supply rate 0.2 ml min−1). After addition of Solution 1, the obtained particles were purified by centrifugation at 18,300g for 3 min and washed with EtOH five times. Finally, the SiO2 microparticles were dried under vacuum.
Grafting of the sub-micrometre-size particles with silane–PEG5k
A 20 mg ml−1 solution of silane–PEG5k (Sigma Aldrich) in EtOH 98% was added over a solution of smSiP at 5 mg ml−1 in EtOH 98% and 2.8% of ammonia. The mixture was stirred overnight at room temperature, and the particles were recovered by centrifugation at 18,300g for 3 min. Finally, the particles were washed three times with distilled water and dried under vacuum overnight. The washing solutions were freeze-dried overnight and the amount of unattached silane–PEG5k weighted for the reaction yield calculation. A 0.05 mg ml−1 solution of smSiP–PEG5k in distilled water was employed for further radiolabelling reactions.
[68Ga]GaCl3
Gallium-68 was eluted as [68Ga]GaCl3 from an Eckert and Ziegler 68Ge/68Ga generator in ultrapure HCl (4 ml, 0.1 M) manufactured to good manufacturing practice requirements (ABX).
Concentration of the [68Ga]GaCl3 elution by cation exchange
The concentration of the elution was carried out using the setup described in Supplementary Fig. 1. First, the 4 ml of the [68Ga]GaCl3 elution were loaded onto a Strata-X-C 33u cartridge (Phenomenex) and the eluate was discarded. Then, the cartridge was washed with 5 ml of an acetone/0.1 M HCl (80:20) solution and the eluate was discarded. Finally, the concentrated [68Ga]GaCl3 was collected by adding 700 µl of an acetone/0.05 M HCl (98:2) solution, dried under a N2 stream and resuspended in 50 µl of 0.5 M HEPES buffer, (pH 4.9). Radio-TLC was performed at the different stages for quality control. The protocol takes approximately 20 min providing a recovery yield of 86.2 ± 8.5%.
Radiolabelling of silica particles at different concentrations with 68Ga
Silica particles were resuspended at different concentrations (from 1 to 0.002 mg ml−1) in 0.5 M HEPES buffer (pH 4.9). Then, 50 µl of the solution was added into a reaction tube before the addition of the concentrated [68Ga]GaCl3 elution in 50 µl of 0.5 M HEPES buffer (pH 4.9). Reactions were conducted at 90 °C for 30 min, and radio-TLC was carried out to calculate the radiochemical yield.
Measurement of particle concentration by flow cytometry
Particle concentrations were calculated by flow cytometry using counting beads (CountBright Absolute Counting Beads, Invitrogen) following the manufacturer’s instructions. Silica particles were resuspended at 0.05 mg ml−1, sonicated for 10 min and passed through a 10 µm cut-off size filter (KX Syringe Filter, Nylon, 25 mm, 10 µm). The CountBright Absolute Counting Beads were warmed to room temperature and vortexed for 30 seconds. Then, 50 µl of beads were added to 300 µl of silica particles and the mixture was vortexed for 30 min to obtain a homogeneous solution. The sample was run on the flow cytometer and the forward scatter (FSC) threshold set to include the beads and the particles on the linear-FSC versus linear-side scatter plot. Afterwards, the fluorescence detector voltage was adjusted for the counting beads and a gating strategy performed to isolate the silica particles and the counting beads populations. Finally, gates on the particles and the absolute counting beads were drawn and 1,000 bead events were recorded for each sample. Using this strategy, the number of particles in solution was calculated using the following equation:
$$begin{array}{l}displaystyle{mathrm{Absolute}},{mathrm{count}},left(frac{mathrm{Particles}}{{{upmu l}}}right)=displaystylefrac{({mathrm{Particles}},{mathrm{count}},times,{mathrm{Counting}},{mathrm{beads}},{mathrm{volume}})}{({mathrm{Counting}},{mathrm{beads}},{mathrm{count}},times,{mathrm{Particles}},{mathrm{volume}})} times,{mathrm{Counting}},{mathrm{beads}},{mathrm{concentration}}left(frac{{mathrm{Beads}}}{{{upmu l}}}right)end{array}$$
Radiolabelling of 500 smSiP
Five-hundred smSiP were added to 50 µl of the concentrated [68Ga]GaCl3 elution in 0.5 M HEPES buffer pH 4.9. Then, 5.6 µl of polysorbate 80 was added and the mixture was heated at 90 °C for 30 min at 900 rpm in a thermal mixer. Afterwards, a final multi-step purification protocol was designed to remove unreacted/colloidal 68Ga. Fifty microlitres of 10 mM EDTA were added, and the mixture was incubated 5 min at room temperature. Then, the particles were centrifuged for 3 min at 18,300g, resuspended in 500 µl of PBS containing 1 mM EDTA + 0.1% polysorbate 80 and gently vortexed for 10 s. The particles were centrifuged again, washed with a solution of 0.1 mM EDTA + 0.1% polysorbate 80 in PBS and gently vortexed for 10 s. Finally, the particles were centrifuged and washed five more times with PBS + 0.1% polysorbate 80 and resuspended in 500 µl PBS. The radiolabelling reaction was monitored by radio-TLC during the successive reaction steps to evaluate the presence of colloids (that can be confused with particles if not removed properly), the radiolabelling of the particles and the purity of the final product. RLY was calculated by comparison between the amount of radioactivity in the particles and the supernatants after the washing steps.
Fractionation
For the fractionation strategy, volumes from 0.5 µl to 20 µl of the 68Ga-smSiP at a theoretical concentration of 1 particle µl−1 were added into different sample tubes in 1 µl steps (0.5, 1, 2, 3…) and PBS was added to bring the final volume to 50 µl. Then, 37.5 µl from the first tube were pipetted into a second sample tube, 25 µl of the second tube into a third tube and finally 12.5 µl of the third tube to a fourth tube. This strategy provides four tubes per sample with a final volume of 12.5 µl per tube. The radioactivity in each tube was measured in a gamma counter and the values were calculated in kBq using a calibration curve, for further comparison and analysis. The samples containing most of the radioactivity in only one tube were sonicated for 30 s at room temperature and subjected to a second fractionation step. Then, the samples in which all the radioactivity was found in a single tube (with negligible activity in the other three tubes) were used for further in vivo/ex vivo experiments.
PET/CT phantom imaging
A phantom imaging experiment was carried out with one 68Ga-smSiP. A cannula was used to deliver the particle into a sample tube to evaluate whether a single particle could remain trapped in the cannula tubing during administration. Briefly, the phantom tube was placed in the nanoPET/CT scanner with the end of the cannula tip attached to the tube. After starting the PET acquisition, the particle resuspended in 100 µl of PBS was delivered with an insulin syringe attached to the beginning of the cannula. Then, the cannula was washed with 50 µl of PBS to ensure the delivery of the particle into the phantom tube. The PET acquisition was carried out for 2 h followed by a standard CT scan.
In vivo PET/CT imaging
Animal imaging studies were ethically reviewed and carried out in accordance with the Animals (Scientific Procedures) Act 1986 (ASPA) UK Home Office regulations governing animal experimentation. In vivo imaging was conducted in healthy 8-week-old BALB/c mice. Animals were anaesthetized with isoflurane (2–3% in oxygen), cannulated and placed on the scanner bed under anaesthesia. The bed was heated to 37 °C by internal air flow to keep the animal at normal body temperature, and the respiration rate was monitored and maintained at 60–80 breaths min−1 throughout the scan. Maintaining control over the animal temperature is important, as an unexpected drop in temperature could lead to a reduction in the velocity of the particle in blood. One 68Ga-smSiP (n = 4) or 68Ga-smSiP–PEG5k particle (n = 2) was administered through the cannula in 100 µl of PBS, followed by wash with 50 µl PBS after starting the PET acquisition (1:5 coincidence mode; 5 ns coincidence time window). PET was recorded for 2 h, and then a semicircular CT scan was performed. Animal body temperature and respiratory rate were monitored during the whole process. Dynamic PET/CT images were reconstructed using Tera-Tomo 3D reconstruction (400–600 keV energy window, 1:5 coincidence mode, 20 iterations and 1 subset) at a voxel size of 0.4 × 0.4 × 0.4 mm3 and corrected for attenuation, scatter and decay. List-mode data for all PET/PEPT acquisitions can be found for 68Ga-smSiP at ref. 29 and for 68Ga-smSiP–PEG5k at ref. 30.
Real-time tracking
First, data were exported from the scanner in listmode format (that is, a format with a timestamp and crystal index for detected coincidence photons). A geometric transformation was applied to convert from crystal indices to position in mm units. The Birmingham method iteratively calculates the MDP from a subset of all the LoRs. It does this by discarding LoRs that are further than a set distance from the MDP as these are likely to arise from false LoRs, for example, LoRs that may originate from scatter. The MDP is refined with each iteration; the number of iterations is effectively set by the f-factor and relates to the total number of LoRs that are used to estimate the final particle position within that subset (for example, an f-factor of 0.5 means that the iteration loop will terminate when 50% of the LoRs in the subset remain). The number of LoRs used in a subset can be reduced to improve the temporal sampling (the subsets are time consecutive with no overlap) at the cost of increasing the uncertainty in position (further details of the algorithm can be found in Parker et al.5) The Birmingham method was used to analyse list-mode data from the PET scanner. An adaptive sample size was used to track the particle in the mice. The sample size was set to achieve a balance of sufficient temporal sampling while minimizing positioning errors. A sample size between 100 and 200 LoRs was used in the early stages of the scans (<60 s from scan start), with f = 0.1, yielding approximately 1–5 s intervals. At scanning times >60 s, sample sizes were varied between 1,000 and 2,000, which yielded time intervals of between 30 s and 60 s depending on the in vivo experiment. The number of counts used to calculate the MDP (in the final iteration) can be found by multiplying the sample size by the f-factor value. These parameters were based on prior experience and informed by previous publications1.
Speed was obtained as (sqrt{{v}_{x}^{2}+{v}_{y}^{2}+{v}_{z}^{2}}) where ({v}_{m}^{2}) is the velocity in the x, y and z directions.
Ex vivo organ uptake
Uptake in different organs was evaluated by gamma counting. After the in vivo PET/CT imaging, animals were killed by cervical dislocation and organs excised and weighed for radioactivity counting in a gamma counter (LKB Wallac 1282 Compugamma CS). Data were expressed as percentage injected dose (dose in the organ/total dose injected) per gram of tissue (%ID g−1).
Autoradiography
The radioactivity in the lungs was traced with a radiation detector (EP15 probe, Morgan), and the lungs were cut into small sections with a scalpel until a small portion of tissue with the radioactive signal was obtained. The tissue was snap frozen in −80 °C isopropanol. Immediately after freezing, the tissue was embedded in optimal cutting temperature medium and cut in a cryostat in 20 µm slices. Each slice was surveyed with the detector until the radioactive slice was found. The previous (below background), radioactive and next (below background) slice were placed on a Superfrost microscope slide (Epredia). The rest of the remaining tissue was also below background. The microscope slide with the three sections was covered with cling film and opposed to a GE autoradiography plate overnight. The plate was analysed using GE Amersham Typhoon with 25 µm resolution and PMT setting of 4,000. The autoradiography image was superimposed on the picture of the tissue, showing one spot of radioactivity in the radioactive slice. For the quantification, standards were prepared in different known activities, and each was spotted as 1 µl quintet in paper. The spots were incubated in the same storage phosphor screen, BAS-IP MS (Multipurpose Standard) from GE as the single particles quantified. The image was acquired with the Amersham Typhoon 5 with the Control Software version 2.0 in the phosphor mode with a pixel size of 100 µm and a sensitivity of 4,000. The images were quantified with the software ImageQantTL v10.0-261 using the gel quantification toolbox. The spots were corrected by choosing a region immediately before or after the spot as a constant background. The resulting volume of the spot was used to calculate the Bq in the particle on the basis of the calibration curve.
Statistics and reproducibility
For quantitative analysis, a minimum of three biological replicates were analysed excluding the in vivo data of 68Ga-smSiP–PEG5k (n = 2). Data were analysed by ordinary one-way analysis of variance (ANOVA) with Dunnett’s multiple comparisons test and Student’s t-test. A P value <0.05 was considered statistically significant.
- SEO Powered Content & PR Distribution. Get Amplified Today.
- PlatoData.Network Vertical Generative Ai. Empower Yourself. Access Here.
- PlatoAiStream. Web3 Intelligence. Knowledge Amplified. Access Here.
- PlatoESG. Carbon, CleanTech, Energy, Environment, Solar, Waste Management. Access Here.
- PlatoHealth. Biotech and Clinical Trials Intelligence. Access Here.
- Source: https://www.nature.com/articles/s41565-023-01589-8
- :is
- :not
- :where
- ][p
- 000
- 1
- 10
- 100
- 12
- 15%
- 19
- 20
- 200
- 2016
- 2022
- 2023
- 23
- 25
- 250
- 26
- 27
- 28
- 29
- 30
- 300
- 33
- 3d
- 50
- 500
- 60
- 65
- 700
- 75
- 8
- 80
- 9
- 90
- 98
- a
- Absolute
- accordance
- Achieve
- acquired
- acquisition
- acquisitions
- Act
- activities
- activity
- adaptive
- added
- adding
- addition
- Adjusted
- administered
- administration
- advances
- After
- afterwards
- again
- AIR
- AL
- algorithm
- All
- also
- Ammonia
- amount
- an
- analyse
- analysis
- Anchor
- and
- animal
- animals
- applied
- approximately
- ARE
- arise
- AS
- At
- b
- background
- Balance
- base
- based
- basis
- BD
- BE
- before
- Beginning
- below
- between
- Birmingham
- blood
- body
- briefly
- bring
- buffer
- by
- calculate
- calculated
- calculates
- calculation
- CAN
- carried
- Catalyst
- cell
- chemicals
- choosing
- click
- coincidence
- comparison
- comparisons
- composed
- Concentrated
- concentration
- conducted
- confused
- consecutive
- considered
- constant
- continuously
- control
- controlled
- convert
- corrected
- Cost
- could
- Counter
- counting
- covered
- Crystal
- cs
- curve
- Cut
- cutting
- data
- deliver
- delivered
- delivery
- Depending
- described
- designed
- details
- detected
- determined
- developed
- differences
- different
- directions
- dislocation
- distance
- does
- dose
- drawn
- Drop
- during
- dynamic
- e
- E&T
- each
- Early
- effectively
- electrolyte
- embedded
- emission
- employed
- end
- energy
- Engineering
- ensure
- equipment
- Errors
- estimate
- Ether (ETH)
- evaluate
- evaluated
- events
- example
- Except
- excluding
- experience
- experiment
- experiments
- expressed
- false
- Fig
- Film
- filter
- final
- Finally
- First
- five
- flow
- followed
- following
- For
- format
- Forward
- found
- four
- Fourth
- Freezing
- from
- frozen
- FSC
- further
- Gates
- ge
- generator
- glass
- good
- governing
- Gram
- Growth
- healthy
- here
- Home
- Home Office
- HTTPS
- if
- image
- images
- Imaging
- immediately
- important
- improve
- in
- include
- increasing
- incubated
- independent
- index
- Indices
- informed
- instant
- instructions
- instrument
- instruments
- integrated
- Interface
- internal
- into
- IT
- iteration
- iterations
- Keep
- known
- Kx
- lead
- likely
- LINK
- Lungs
- maintaining
- manufactured
- manufacturing
- material
- May..
- means
- measured
- measuring
- medium
- method
- methods
- mice
- micron
- Microscope
- min
- minimizing
- minimum
- mixer
- mixture
- ML
- Mobile
- Mode
- monitored
- more
- Morgan
- most
- MS
- multiple
- multiplying
- nanotechnology
- Nature
- next
- no
- normal
- number
- obtain
- obtained
- of
- Office
- on
- ONE
- only
- opposed
- optimal
- or
- ordinary
- Other
- otherwise
- out
- over
- overnight
- Oxygen
- Paper
- parameters
- particle
- passed
- PBS
- per
- percentage
- performed
- pet
- phantom
- phase
- Photons
- picture
- Pixel
- placed
- plato
- Plato Data Intelligence
- PlatoData
- populations
- portion
- position
- positioning
- positron
- practice
- prepared
- presence
- previous
- previously
- Prime
- Prior
- probe
- procedures
- process
- produce
- Product
- properly
- protocol
- provide
- provides
- providing
- purchased
- quality
- quantification
- quantitative
- quantity
- R
- Radiation
- Radio
- range
- Rate
- reaction
- reactions
- real-time
- received
- recent
- recorded
- recovery
- Reduced
- reduction
- reference
- refined
- region
- regulations
- relates
- remain
- remaining
- remove
- Removed
- replicates
- Requirements
- Resolution
- REST
- resulting
- review
- reviewed
- Room
- Run
- s
- same
- scan
- scanning
- scans
- SCI
- scientific
- Screen
- Second
- seconds
- sections
- SEM
- Sensitivity
- set
- setting
- setup
- showing
- Sigma
- Signal
- significant
- Silicon
- single
- Size
- sizes
- Slice
- Slide
- small
- Snap
- Software
- solution
- Solutions
- Source
- specific
- Spot
- spots
- stages
- standard
- standards
- start
- Starting
- stated
- statistically
- Step
- Steps
- storage
- Strategy
- stream
- studied
- studies
- Studying
- sufficient
- supply
- surveyed
- synthesis
- takes
- technique
- Technologies
- test
- than
- that
- The
- then
- theoretical
- thermal
- These
- Third
- this
- three
- threshold
- Through
- throughout
- time
- times
- timestamp
- tip
- tissue
- to
- tool
- Toolbox
- Total
- track
- Tracking
- Transformation
- trapped
- two
- Uk
- Uncertainty
- under
- Unexpected
- units
- until
- used
- using
- Vacuum
- value
- Values
- VeloCity
- version
- Versus
- vivo
- Voltage
- volume
- volumes
- Voxel
- W
- was
- washing
- Water
- were
- when
- whether
- which
- while
- whole
- will
- window
- with
- within
- Yield
- yielded
- yielding
- zephyrnet
- Zip

