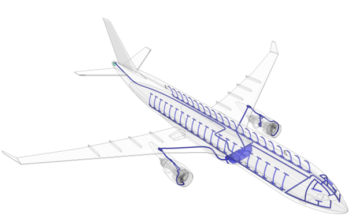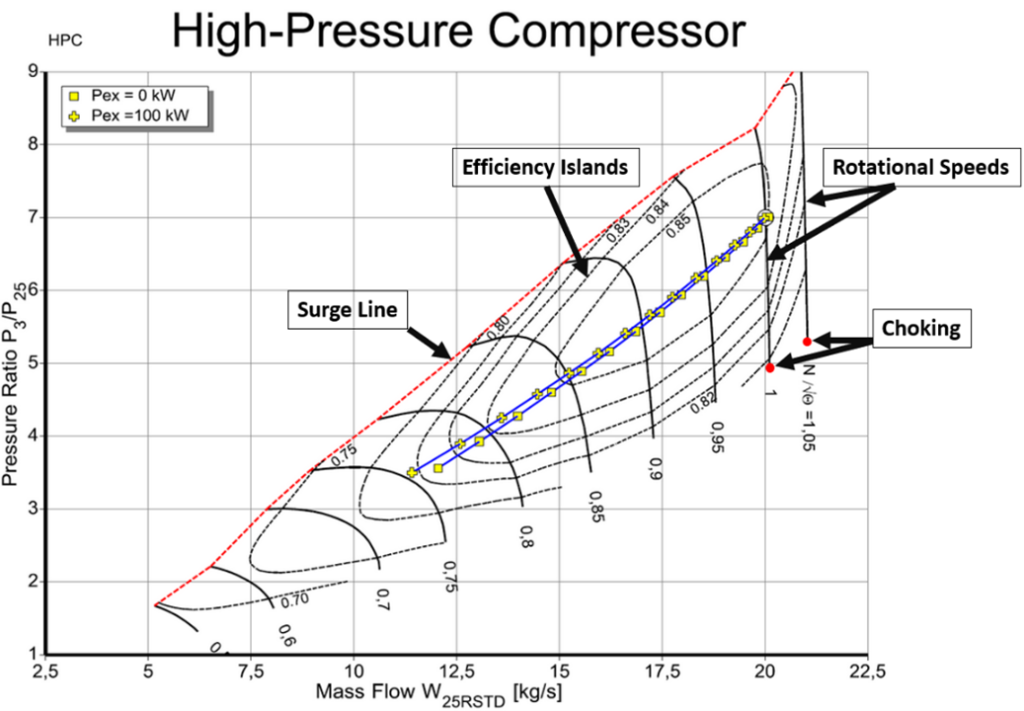
A performance map is a key step in the design process of axial compressors. Performance maps represent the compressor characteristics and are used for compressor turbine matching and stall margin evaluation. Maps can also be used to compare different compressors, in order to determine which design would be most suitable for a given application. To accomplish these goals, maps usually plot the pressure ratio against corrected mass flow rate and corrected rotational speed. The map has a left bound limit called the surge line, and a right bound limit called the choke line.

With the wide use of CFD technology and the ever-increasing processing power of computers, much of the experimental testing nowadays is performed digitally via CFD calculation. Going this route drastically reduces the cost of creating the map, since no sophisticated test rig is needed, and the entire process of running multiple operating points can be automated. However, the process is still quite slow, as it requires a sufficiently fine mesh to receive accurate results.
It is important to note that a performance map is only valid for a set geometry. This fact presents a challenge when dealing with high-pressure compressors, which reach high relative Mach numbers at the tip region, and often call for the usage of variable guide vanes (VGV). If we wanted to generate accurate maps for a compressor that has variable guide vanes, we would need to create a map for every possible combination of guide vane angles. This would be impractical. Instead, we could generate a map for selected IGV/VGV combinations, and utilize various interpolation techniques to determine the compressor performance at any arbitrary combination. However, the interpolation techniques are much less accurate with sparse distributions of maps at different IGV/VGV combinations.
So, how do we save time and money while still producing accurate performance maps for our high-pressure compressors? One neat option is using artificial intelligence (AI)—as has been done by Burlaka and Moroz [2]. There, an AI model was trained to predict the performance of 10-stage axial compressors with variable guide vanes. Figure 2 shows extraction of their study results. It shows the AI prediction (red line) for pressure ratio, efficiency, various speed lines, and a certain combination of VGV angles.
The fact that the user neither needs to apply interpolation techniques nor to run expensive calculations or tests to determine the performance map at different VGV angles is a major advantage. The model can generate a performance map for any VGV angle combination, as long as the desired angles are not out of the training range. Burlaka and Moroz proceeded by using the AI model to find the optimal VGV angles for a certain operating point. Of course, if we only need to calculate a handful of operating points, training an AI model would not save us much. But if we need to calculate many points, then the AI’s advantages truly shine. In these latter cases, the time spent on training and usage is significantly lower than calculating each point individually, be it through CFD or experiment.

Dots: Actual Data; Red Lines: AI Model Predictions [2]
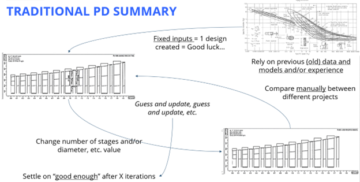
The conclusion is that while performance maps are essential, their creation through traditional approaches is overly resource-intensive (especially if variable geometries are included in our compressor). The use of AI will enable us to generate these maps faster, and at the same time enhance the optimization process of our compressor geometry.
If you would like to know more about compressor design and software tools to improve your development process, please reach out to us at info@softinway.com, or if you are at this year’s Turbo Expo in Rotterdam, pick up your free guest pass and visit us at our booth #424!
References:
[1] https://www.google.com.ua/search?q=aircraft+compressor+map&sa=X&rlz=1C1EJFA_enUA767UA767&tbm=isch&tbo=u&source=univ&ved=2ahUKEwi-i9mSy7zcAhXKESwKHQ3XB_oQsAR6BAgDEAE&biw=1745&bih=885#imgrc=yxnyHJR695tb5M [2] Burlaka, Maksym. and Moroz, Leonid. “Axial Compressor Map Generation Leveraging Autonomous Self-training AI.” Proceedings of ASME Turbo Expo 2022- SEO Powered Content & PR Distribution. Get Amplified Today.
- Platoblockchain. Web3 Metaverse Intelligence. Knowledge Amplified. Access Here.
- Source: https://blog.softinway.com/how-ai-improves-axial-compressor-map-generation/
- 1
- 2022
- a
- About
- accurate
- ADvantage
- advantages
- against
- AI
- allows
- and
- Application
- Apply
- approach
- approaches
- artificial
- artificial intelligence
- Automated
- autonomous
- calculating
- call
- called
- cases
- certain
- CFD
- challenge
- characteristics
- COM
- combination
- combinations
- compare
- comparison
- components
- computers
- conclusion
- corrected
- Cost
- could
- course
- create
- Creating
- creation
- data
- dealing
- Design
- design process
- Determine
- Development
- different
- digitally
- distributions
- drastically
- each
- Early
- efficiency
- enable
- Entire
- equipment
- especially
- essential
- evaluation
- ever-increasing
- exactly
- expensive
- experiment
- Expo
- faster
- Figure
- finalized
- Find
- fine
- flow
- Free
- generate
- generation
- given
- Goals
- going
- Guest
- guide
- handful
- High
- highly
- How
- However
- HTTPS
- important
- improve
- in
- included
- Individually
- instead
- integrated
- Intelligence
- IT
- Key
- Know
- lead
- leveraging
- LIMIT
- Line
- lines
- Long
- machine
- major
- many
- map
- Maps
- Margin
- Mass
- matching
- max-width
- model
- money
- more
- most
- multiple
- Need
- needs
- Neither
- numbers
- ONE
- operating
- operator
- optimal
- optimization
- Option
- order
- Others
- performance
- physical
- plato
- Plato Data Intelligence
- PlatoData
- please
- Point
- points
- possible
- power
- predict
- prediction
- Predictions
- presents
- pressure
- Proceedings
- process
- processing
- Processing Power
- prototype
- range
- Rate
- ratio
- reach
- receive
- Red
- reduces
- region
- represent
- requires
- resource-intensive
- Results
- rig
- Route
- Run
- running
- same
- Save
- selected
- sensors
- set
- shine
- Shows
- significantly
- since
- slow
- Software
- sophisticated
- speed
- spent
- Step
- Still
- Study
- such
- suitable
- surge
- techniques
- Technology
- test
- Testing
- tests
- The
- their
- Through
- time
- time-consuming
- tip
- to
- tools
- traditional
- trained
- Training
- TURN
- us
- Usage
- use
- User
- usually
- utilize
- various
- via
- wanted
- which
- while
- wide
- will
- would
- Your
- zephyrnet