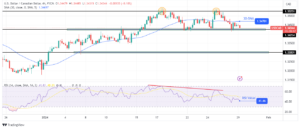
- The bias is bearish in the short term despite temporary rebounds.
- The ECB should bring sharp movements later today.
- Taking out the 150% Fibonacci line activates more declines.
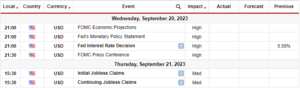
The gold price dropped to $1,928 today, posting a fresh multi-week low. The USD’s appreciation after the FOMC forced the XAU/USD to tumble.
–Are you interested to learn more about day trading brokers? Check our detailed guide-
The bias is bearish in the short term, so more declines are expected. Still, after the last sell-off, we cannot exclude a temporary rebound. The yellow metal crashed even though the Federal Reserve maintained the Federal Funds Rate at 5.25% as expected, while the PPI dropped by 0.3% compared to the 0.1% drop estimated.
Gold plunged as the FED announced potential new hikes in the upcoming monetary policy meetings. Today, the New Zealand GDP reported a 0.1% drop, as expected, while the Australian Unemployment Rate and Employment Change came in better than expected.
Furthermore, the Chinese reported mixed data. Later, the fundamentals should drive the markets. The ECB should increase the Main Refinancing Rate to 4.00% from 3.75%.
The Monetary Policy Statement and the ECB Press Conference could bring sharp movements in all markets, not only the XAU/USD.
In addition, the US is to release the Retail Sales, Core Retail Sales, Empire State Manufacturing Index, Unemployment Claims, Industrial Production, Capacity Utilization Rate, Philly Fed Manufacturing Index, and Business Inventories data.
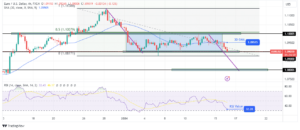
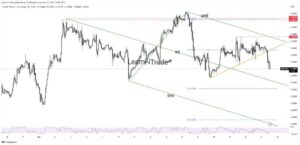
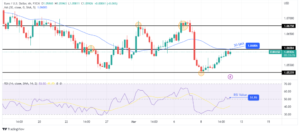
Gold price technical analysis: Bearish dominance
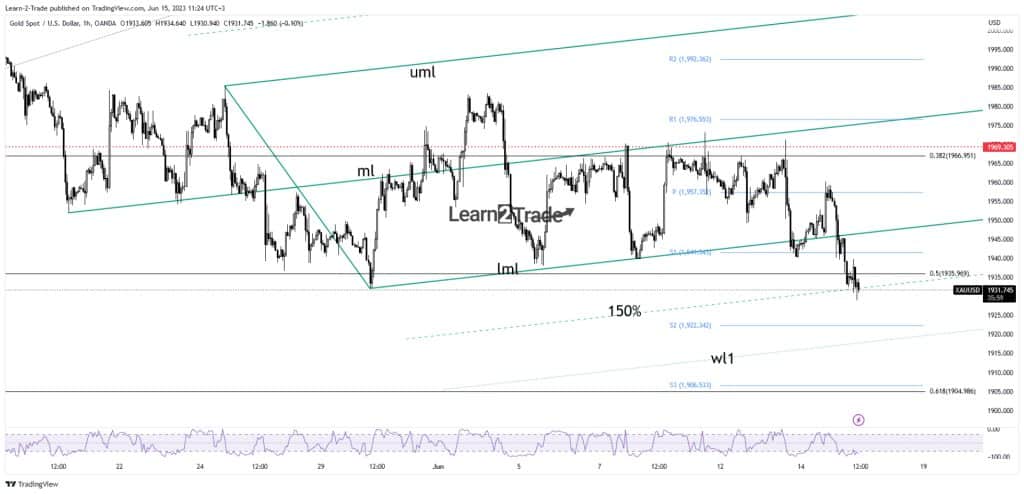
Technically, it took out the ascending pitchfork’s lower median line (lml) and the weekly S1 (1,941), signaling more declines.
–Are you interested to learn more about automated trading? Check our detailed guide-
Now, it has dropped below the 50% (1,935) retracement level, representing a downside obstacle. In the short term, after the last sell-off, the XAU/USD could try to rebound after failing to stay below the 150% Fibonacci line.
Still, the yellow metal may test the near-term resistance levels before going down again. From my previous analysis, you knew that its failure to reach and retest the median line (ml) in the last attempt announced exhausted buyers and strong downside pressure. Taking out the 150% Fibonacci line activates a downside continuation.
Looking to trade forex now? Invest at eToro!
67% of retail investor accounts lose money when trading CFDs with this provider. You should consider whether you can afford to take the high risk of losing your money.
- SEO Powered Content & PR Distribution. Get Amplified Today.
- EVM Finance. Unified Interface for Decentralized Finance. Access Here.
- Quantum Media Group. IR/PR Amplified. Access Here.
- PlatoAiStream. Web3 Data Intelligence. Knowledge Amplified. Access Here.
- Source: https://www.forexcrunch.com/gold-price-breaks-1940-after-fed-eying-ecb/
- :has
- :is
- :not
- 1
- 1% drop
- 167
- 30
- a
- About
- Accounts
- addition
- After
- again
- All
- analysis
- and
- announced
- appreciation
- ARE
- AS
- At
- Australian
- Australian Unemployment Rate
- bearish
- before
- below
- Better
- bias
- breaks
- bring
- business
- buyers
- by
- came
- CAN
- cannot
- Capacity
- CFDs
- change
- Chart
- check
- chinese
- claims
- compared
- Conference
- Consider
- Container
- continuation
- Core
- could
- Crashed
- data
- Declines
- Despite
- detailed
- down
- downside
- drive
- Drop
- dropped
- ECB
- Empire
- employment
- estimated
- Even
- expected
- failing
- Failure
- Fed
- Federal
- Federal Funds Rate
- federal reserve
- Fibonacci
- FOMC
- forex
- fresh
- from
- Fundamentals
- funds
- GDP
- going
- Gold
- gold price
- High
- Hikes
- HTTPS
- in
- Increase
- index
- industrial
- Industrial Production
- interested
- Invest
- investor
- IT
- ITS
- Last
- later
- LEARN
- Level
- levels
- Line
- lose
- losing
- Low
- lower
- Main
- manufacturing
- Markets
- max-width
- May..
- meetings
- metal
- mixed
- ML
- Monetary
- Monetary Policy
- money
- more
- movements
- my
- New
- New Zealand
- New Zealand GDP
- now
- obstacle
- of
- only
- our
- out
- Philly Fed Manufacturing Index
- plato
- Plato Data Intelligence
- PlatoData
- policy
- potential
- ppi
- press
- pressure
- previous
- price
- price chart
- Production
- provider
- Rate
- reach
- rebound
- release
- Reported
- representing
- Reserve
- Resistance
- retail
- Retail Sales
- retracement
- Risk
- ROW
- sales
- sell-off
- sharp
- Short
- should
- So
- State
- Statement
- stay
- Still
- strong
- SVG
- Take
- taking
- Technical
- Technical Analysis
- temporary
- term
- test
- than
- that
- The
- the Fed
- The Weekly
- this
- though?
- to
- today
- took
- trade
- Trading
- try
- unemployment
- unemployment rate
- upcoming
- us
- we
- weekly
- when
- whether
- while
- with
- XAU/USD
- yellow
- you
- Your
- Zealand
- zephyrnet