- The US data could be decisive later today.
- Taking out the R3 could bring us new longs.
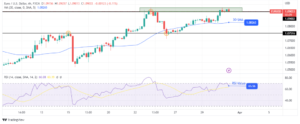
- The current sideways movement is seen as a bullish formation.
The gold price moves sideways in the short term, trying to attract more buyers before jumping higher. The metal is priced at around $1,959 at the time of writing. It looks poised to hit new highs as the US dollar remains bearish.
-If you are interested in Islamic forex brokers, check our detailed guide-
The metal is priced at around $1,959 at the time of writing. It looks poised to hit new highs as the US dollar remains bearish.
XAU/USD edged higher after the US reported lower inflation in June. Yesterday, the US reported mixed data, that’s why the yellow metal stays higher.
The PPI and Core PPI indicators reported only a 0.1% growth in June versus the 0.2% growth estimated. Gold retreated a little in the short term only because the US Unemployment Claims came in at 237K versus 251K expected and versus 249K in the previous reporting period.
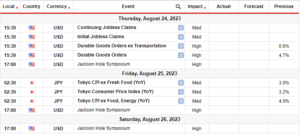
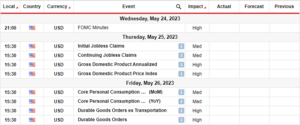
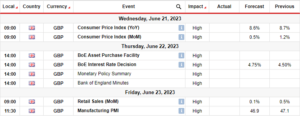
Today, the US data could bring action on the XAU/USD again. The Prelim UoM Consumer Sentiment could really shake the markets in the short term.
The economic indicator is expected to be at 65.5 points, above 64.4 points in the previous reporting period. The USD could appreciate if the data comes in line with expectations or better.
In addition, the Prelim UoM Inflation Expectations and Import Prices figures will be released as well.
Gold Price Technical Analysis: Buyers Still in the Game
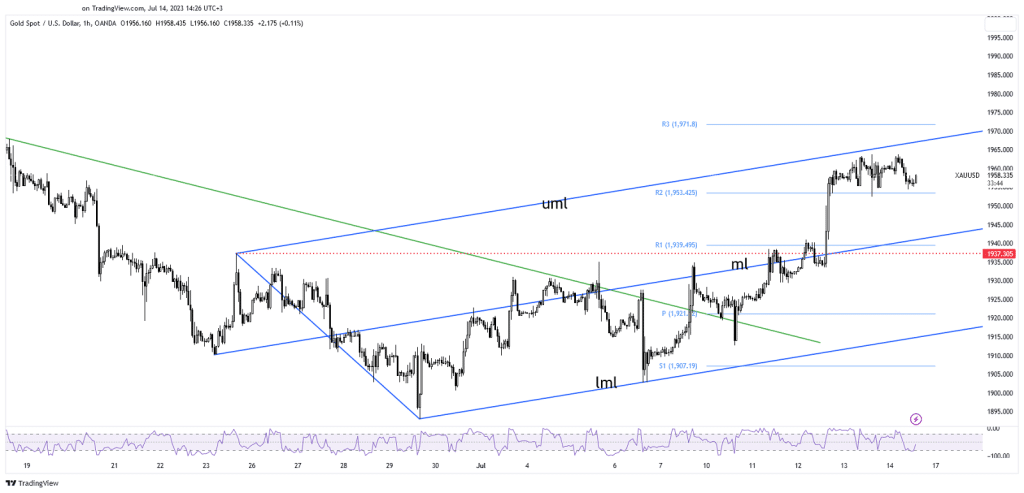
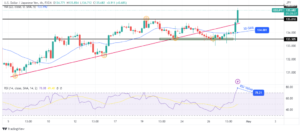
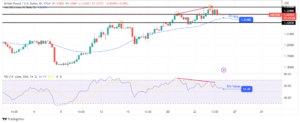
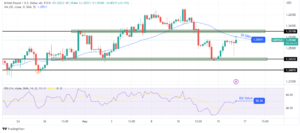
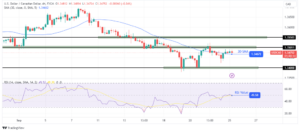
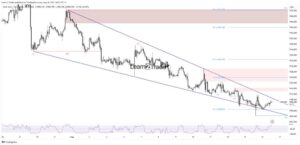
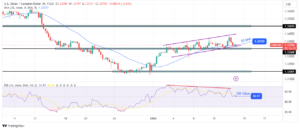
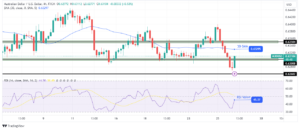
XAU/USD consolidates above the weekly R2 of $1,953 before developing a new bullish momentum. The false breakdown below this static support signaled strong upside pressure.
-If you are interested in brokers with Nasdaq, check our detailed guide-
The ascending pitchfork’s upper median line (uml) represents a dynamic resistance. From the technical point of view, the current range may represent an upside continuation pattern.
After the last rally, a retreat or an accumulation was expected as the price needed more bullish energy before jumping higher.
A valid breakout above the upper median line (uml) should announce further growth ahead. Taking out the R3 (1,971) could bring us new longs.
Looking to trade forex now? Invest at eToro!
67% of retail investor accounts lose money when trading CFDs with this provider. You should consider whether you can afford to take the high risk of losing your money.
- SEO Powered Content & PR Distribution. Get Amplified Today.
- PlatoData.Network Vertical Generative Ai. Empower Yourself. Access Here.
- PlatoAiStream. Web3 Intelligence. Knowledge Amplified. Access Here.
- PlatoESG. Automotive / EVs, Carbon, CleanTech, Energy, Environment, Solar, Waste Management. Access Here.
- BlockOffsets. Modernizing Environmental Offset Ownership. Access Here.
- Source: https://www.forexcrunch.com/gold-price-consolidating-below-1960-ahead-of-breakout/
- :is
- 1
- 167
- 2%
- 30
- 65
- 971
- a
- above
- Accounts
- accumulation
- Action
- addition
- After
- again
- ahead
- an
- analysis
- and
- Announce
- appreciate
- ARE
- around
- AS
- At
- attract
- BE
- bearish
- because
- before
- below
- Better
- Breakdown
- breakout
- bring
- Bullish
- buyers
- came
- CAN
- CFDs
- check
- claims
- comes
- Consider
- Consolidates
- consolidating
- consumer
- consumer sentiment
- Container
- continuation
- Core
- could
- Current
- data
- decisive
- detailed
- developing
- Dollar
- dynamic
- Economic
- energy
- estimated
- expectations
- expected
- false
- Figures
- forex
- formation
- from
- further
- Gold
- gold price
- Growth
- High
- higher
- Highs
- Hit
- HTTPS
- if
- import
- in
- Indicator
- Indicators
- inflation
- Inflation expectations
- interested
- Invest
- investor
- IT
- june
- Last
- later
- Line
- little
- LOOKS
- lose
- losing
- lower
- Markets
- max-width
- May..
- metal
- mixed
- Momentum
- money
- more
- movement
- moves
- needed
- New
- now
- of
- on
- only
- or
- our
- out
- Pattern
- period
- plato
- Plato Data Intelligence
- PlatoData
- Point
- Point of View
- points
- poised
- ppi
- pressure
- previous
- price
- Prices
- provider
- r2
- R3
- rally
- range
- really
- released
- remains
- Reported
- Reporting
- represent
- represents
- Resistance
- retail
- Retreat
- Risk
- ROW
- seen
- sentiment
- Short
- should
- sideways
- Still
- strong
- support
- SVG
- Take
- taking
- Technical
- Technical Analysis
- term
- The
- The Weekly
- this
- time
- to
- today
- trade
- Trading
- unemployment
- UoM Consumer Sentiment
- UoM Inflation Expectations
- Upside
- us
- US Dollar
- US Unemployment Claims
- USD
- Versus
- View
- was
- weekly
- WELL
- when
- whether
- why
- will
- with
- writing
- XAU/USD
- yellow
- yesterday
- you
- Your
- zephyrnet