Published 56 mins ago
BTC Price Prediction: The ongoing recovery rally in Bitcoin price has taken a halt at $28000 psychological resistance. Moreover, the daily chart showcasing rejection candles at the aforementioned resistance suggests the bullish momentum is getting exhausted. Thus, the coin holders can witness a minor retracement to recuperate buying pressure and check suitability at higher levels.
Key Points
- Higher price rejection candles at $28000 indicate the sellers are actively defending this resistance level
- A potential bearish reversal could plunge the Bitcoin price 10% down to hit the $25000 mark.
- The intraday trading volume in Bitcoin is $36.2 Billion, indicating a 26.2% loss
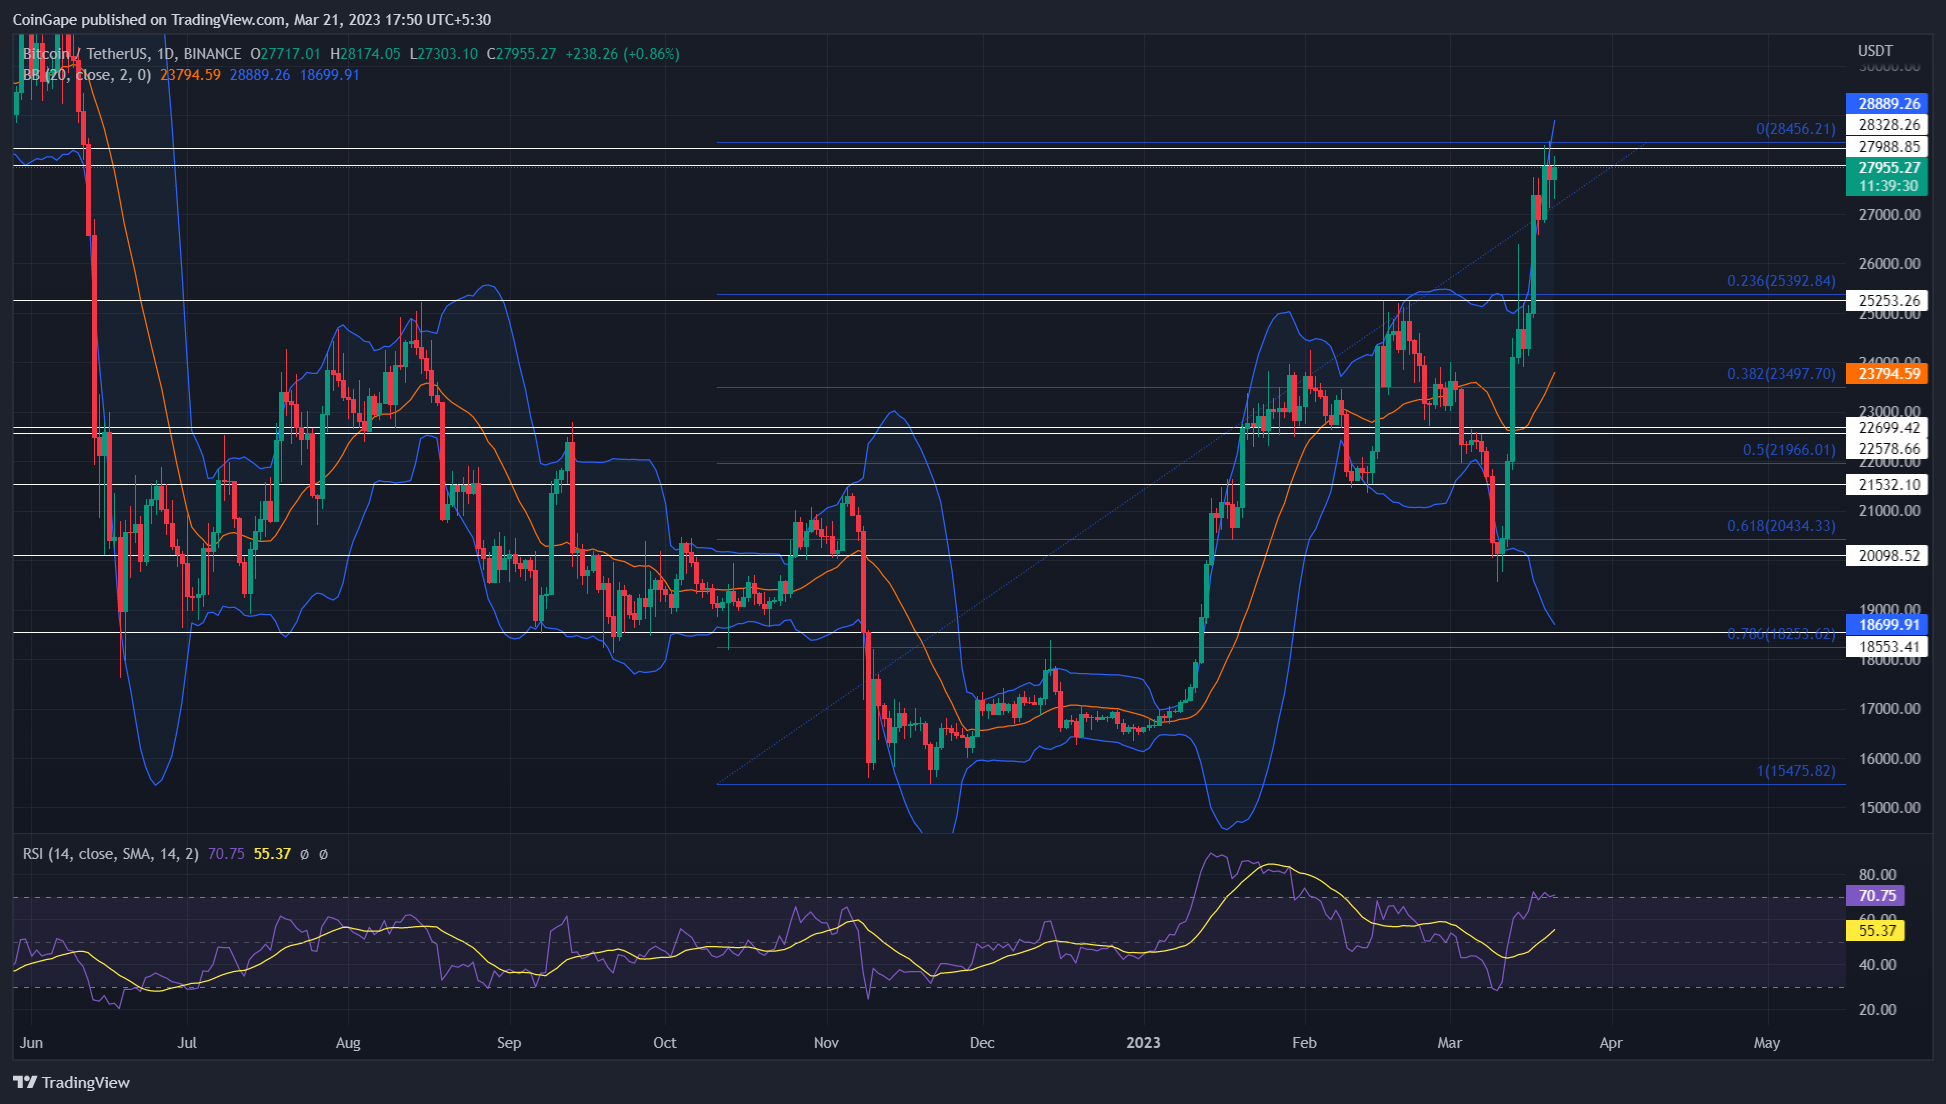
Source-Tradingview
Within a fortnight, the Bitcoin price witnessed an upright rally from the $20000 to the $28000 mark, registering a 40% gain. As of now, the BTC price trades at $27970 and shows a breakout attempt from the $28000-$28300 resistance zone.
Trending Stories
However, in the last two days, the daily chart shows higher price rejection at $28000, indicating the short-term trades must be booking their profit, which increases the possibility of a bearish reversal. If the coin price shows sustainability below the $28000 mark in the few coming days, the sellers may trigger a minor correction phase.
Anyhow, after a massive directional bull run, a temporary correction could check stability at higher prices and replenish the bullish momentum. A potential downtrend may revisit $25200-$25000, which coincides with the 0.236 Fibonacci retracement level.
On a contrary note, a breakout above $28000 will undermine the bearish thesis and encourage buyers to prolong a bullish rally to $32000.
Technical Indicator
RSI: The daily RSI slope moving high in bullish territory indicates the market sentiment favors a recovery sentiment.
Bollinger Band: the BTC price wavering near the upper band of the Bollinger band indicator suggests the bullish rally was aggressive for the given, and therefore a minor retracement phase is needed to stabilize the price trend.
Bitcoin Price Intraday Levels
- Spot rate: $27935
- Trend: Bullish
- Volatility: Medium
- Resistance levels- $28000 and $32000
- Support levels- $25000 and $23870
Share this article on:
advertisement
The presented content may include the personal opinion of the author and is subject to market condition. Do your market research before investing in cryptocurrencies. The author or the publication does not hold any responsibility for your personal financial loss.
- SEO Powered Content & PR Distribution. Get Amplified Today.
- Platoblockchain. Web3 Metaverse Intelligence. Knowledge Amplified. Access Here.
- Source: https://coingape.com/markets/btc-price-prediction-increased-supply-at-28000-threatens-10-correction-in-bitcoin/
- :is
- 1
- 10
- 2%
- 7
- 8
- 9
- a
- above
- actively
- Ad
- After
- aggressive
- and
- ARE
- article
- AS
- At
- author
- avatar
- BAND
- banner
- BE
- bearish
- Beauty
- before
- below
- Billion
- Bitcoin
- Bitcoin Price
- blockchain
- breakout
- Brian
- BTC
- btc price
- BTC price prediction
- bull
- Bull Run
- Bullish
- buyers
- Buying
- CAN
- Chart
- check
- Coin
- Coingape
- COM
- coming
- condition
- content
- contrary
- correction phase
- could
- cryptocurrencies
- cryptocurrency
- daily
- Days
- Defending
- different
- down
- encourage
- Entertainment
- Ether (ETH)
- Fashion
- favors
- few
- finance
- financial
- follow
- For
- from
- Gain
- getting
- given
- Have
- High
- higher
- Hit
- hold
- holders
- How
- HTTPS
- i
- in
- include
- Including
- increased
- Increases
- indicate
- indicates
- indicating
- investing
- journalism
- Last
- levels
- loss
- mark
- Market
- market research
- market sentiment
- massive
- minor
- Momentum
- Moreover
- moving
- Near
- needed
- of
- on
- ongoing
- Opinion
- past
- personal
- phase
- plato
- Plato Data Intelligence
- PlatoData
- plugin
- plunge
- possibility
- potential
- prediction
- presented
- pressure
- price
- Price Prediction
- Prices
- Profit
- Publication
- rally
- Rate
- Read
- recovery
- registering
- research
- Resistance
- responsibility
- retracement
- Reversal
- Run
- Sellers
- sentiment
- Share
- short-term
- showcasing
- Shows
- Stability
- stabilize
- subject
- Suggests
- suitability
- supply
- Sustainability
- temporary
- The
- their
- therefore
- threatens
- to
- Topics
- trades
- Trading
- trading volume
- TradingView
- Trend
- trending
- trigger
- Undermine
- Upright
- variety
- volume
- which
- will
- with
- witness
- witnessed
- Work
- working
- written
- years
- Your
- zephyrnet