
Published 5 hours ago
During mid-April, the crypto market witnessed a significant sell-off as the pioneer cryptocurrency Bitcoin also failed to sustain above the $30000 psychological level. Amid the increasing selling pressure, a majority of major cryptocurrencies witnessed a temporary correction in their ongoing bullish trend offering a suitable pullback opportunity to market participants. Interested traders may grab this opportunity to accumulate their favorite cryptocurrencies at discounted prices.
advertisement
Xrp(XRP)
Source- Tradingview
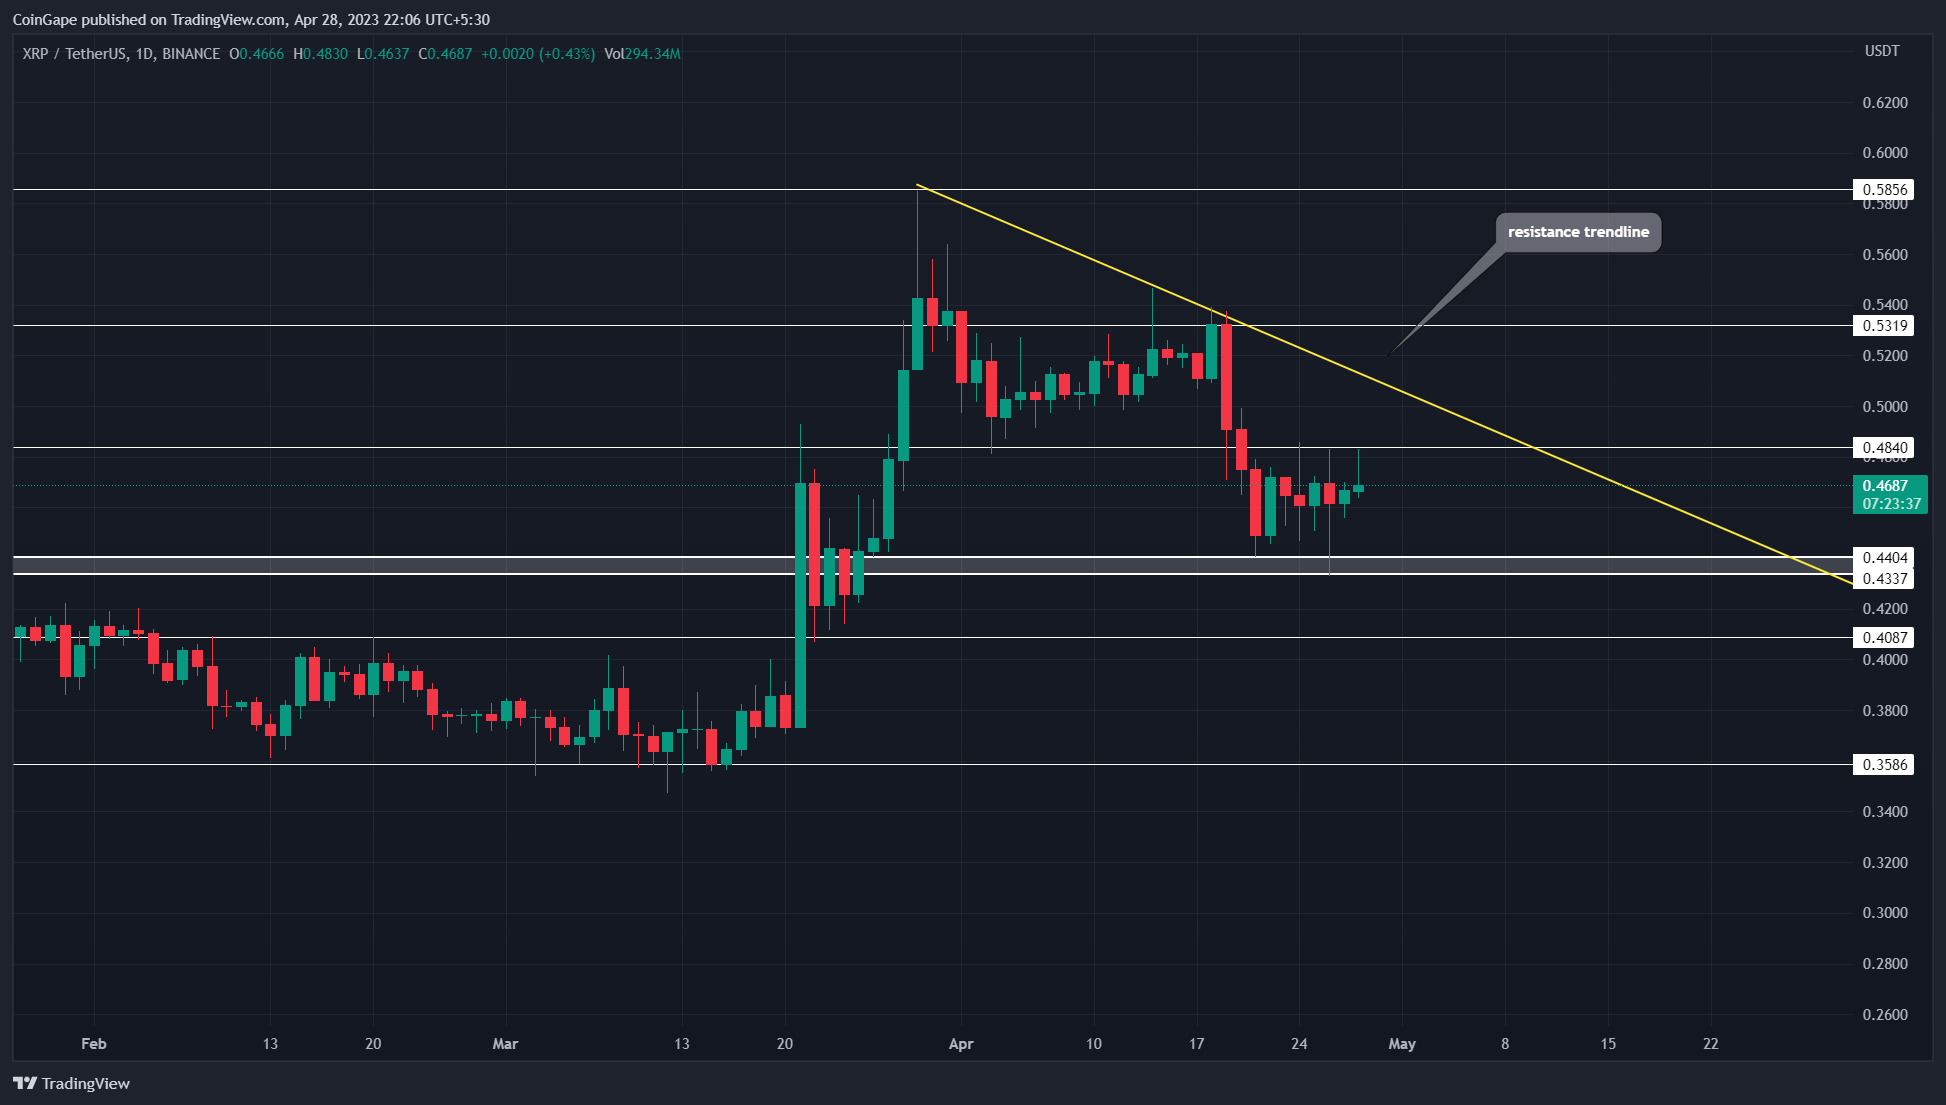
Amid the recent correction, the XRP price plunged to local support of $0.44, which is aligned with the 50% Fibonacci retracement level. A retracement up to this FIB level is considered healthy for the sustained bull run and encourages the market buyers to prolong a bullish rally
By the press time, the XRP price trades at $0.47 and tries to sustain above the $0.44 support.
Trending Stories
Conversely, the daily chart shows a downsloping trendline currently carrying the ongoing correction phase. Thus, the traders waiting for a new long opportunity should wait for the price breakout above this trendline.
A potential breakout above this trendline will accelerate the buying momentum and surge the coin price 25% higher to rechallenge the $0.585.
Solana(SOL)
Source- Tradingview
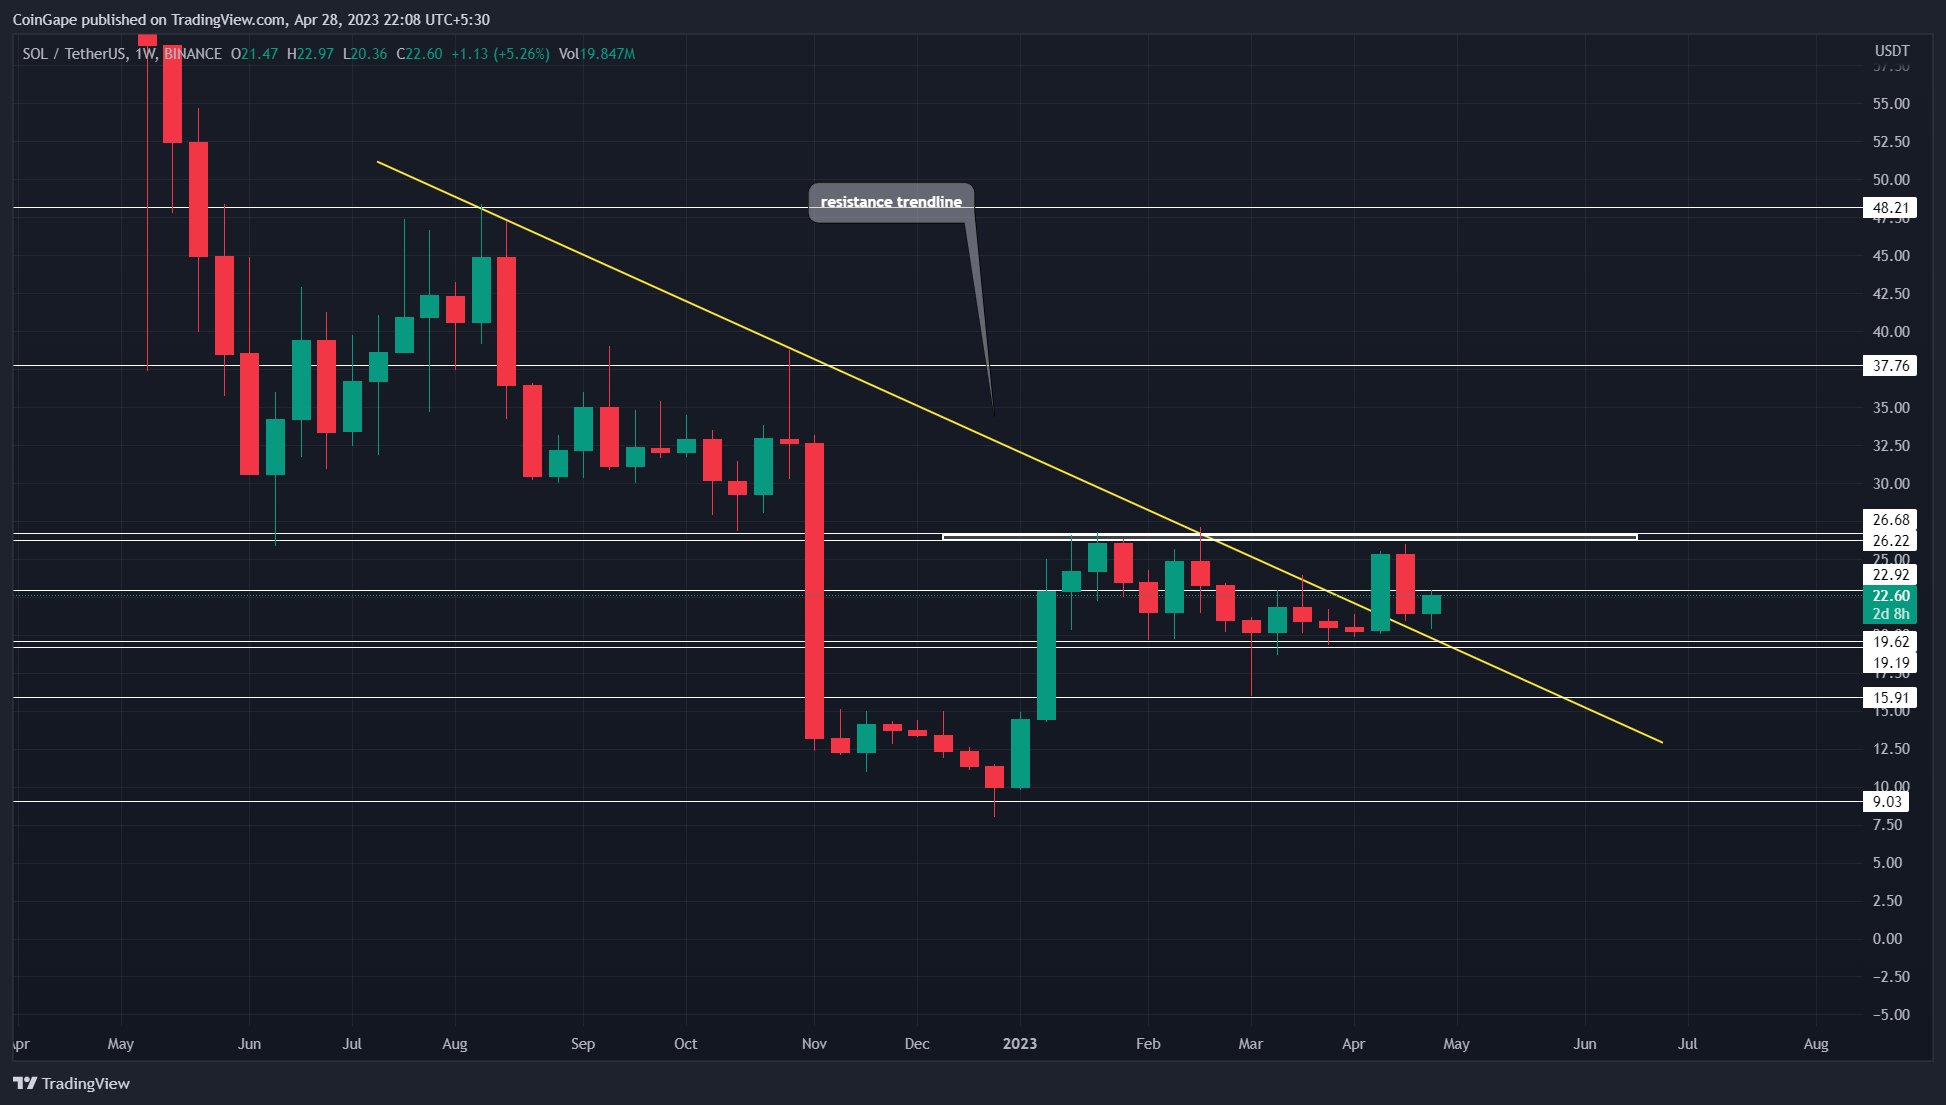
On April 11th, the Solana price gave a decisive breakout above a long-coming resistance trendline reflecting an early sign for trend reversal. Furthermore, the recent correction in the market allows the coin price to retest the breached resistance as potential support.
By the press time, the Solana price trades at $22.34 with an intraday gain of 0.09%
If the coin price sustains above the aforementioned trendline it would indicate the market sentiment on selling on rallies shifted to buying dips. The potential recovery may surge the SOL price by 20% rise to hit $26.6 followed by $30, and $37.75.
Also Read: 15 New Cryptocurrencies To Buy In 2023
Polygon(MATIC)
Source- Tradingview
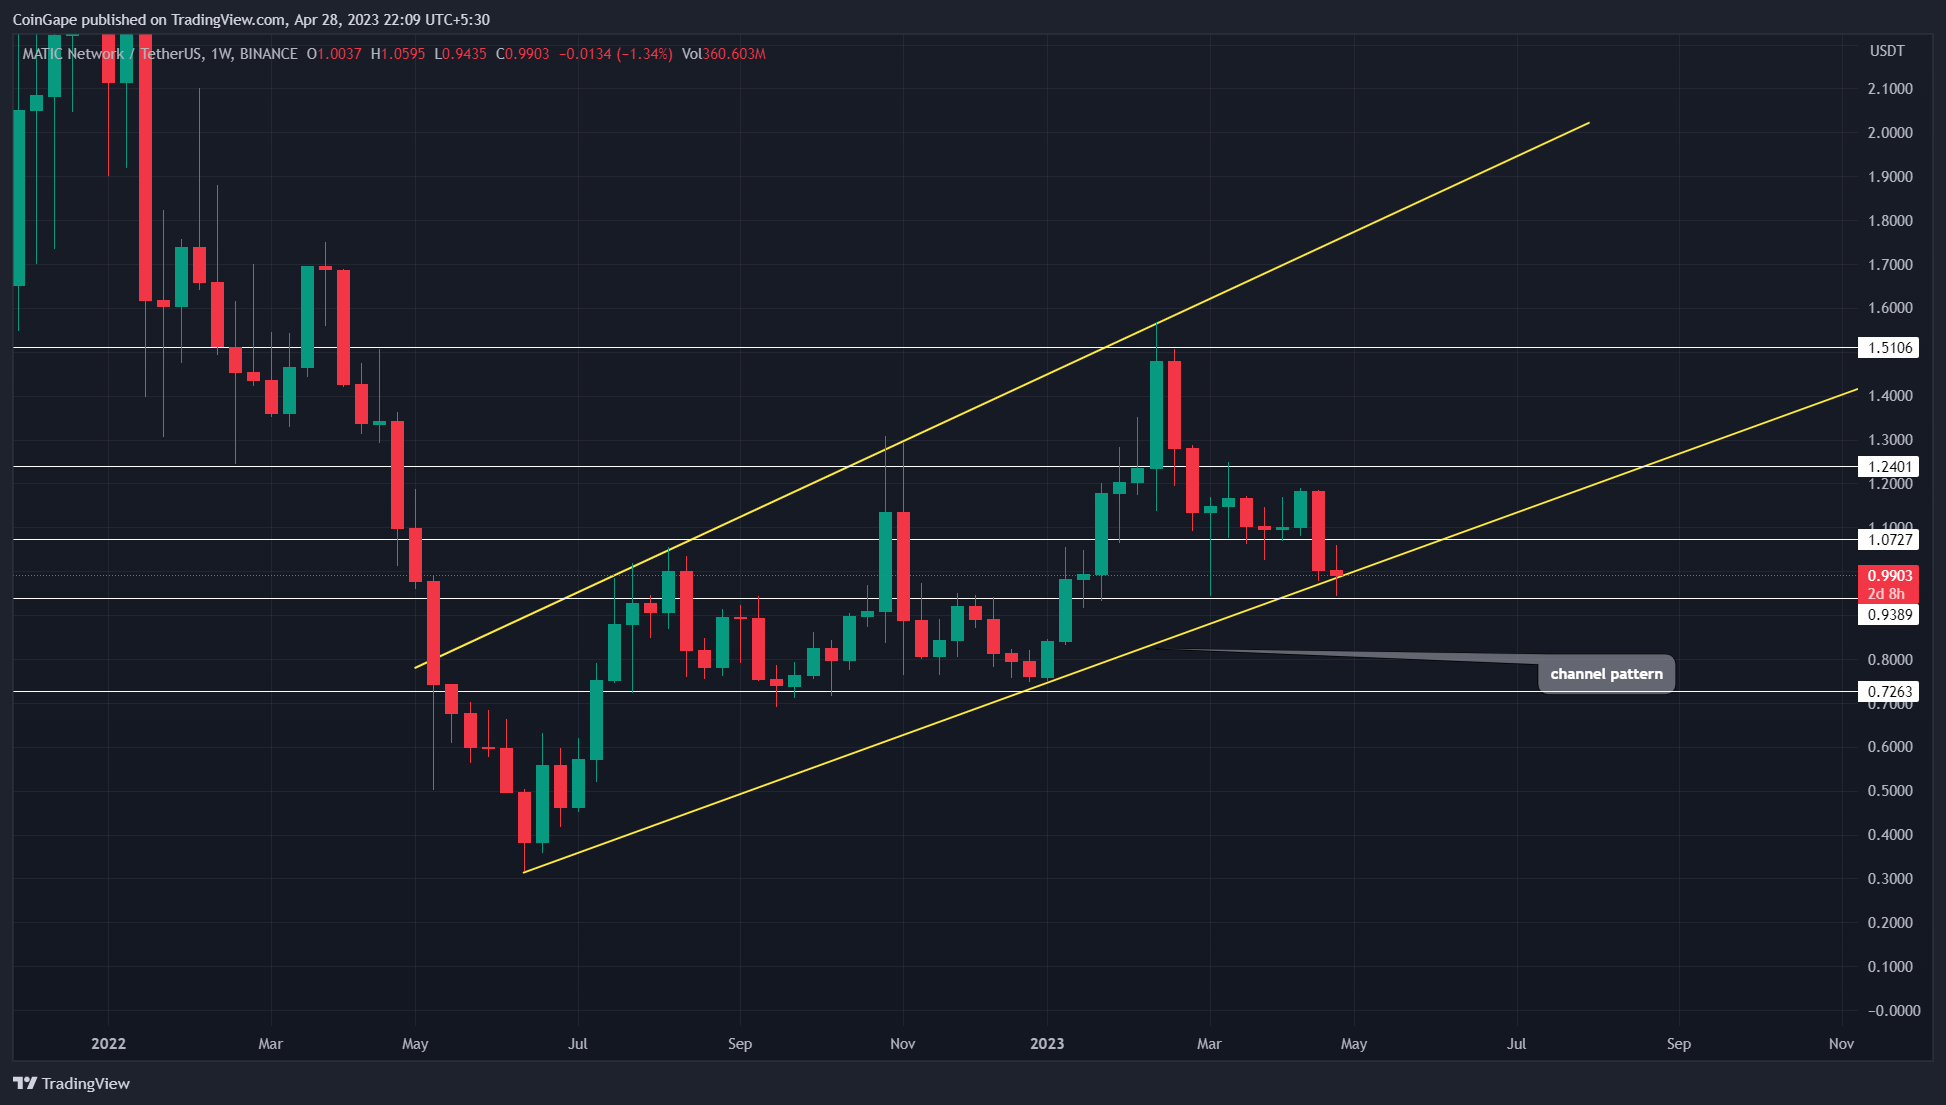
For the past ten months, the MATIC price has been riding a sustained rally under the influence of a d. Using this pattern’s support trendline, the buyers are offered pullback opportunities to reaccumulate this altcoin for a prolonged bullish rally.
As of now, the MATIC price trades at $0.98 and revisits the dynamic support trendline. The lower price rejection candle near this trend indicates the buyers continue to defend this level which most likely triggers a fresh recovery rally.
In ideal conditions, a bullish reversal support trendline may drive the asset price to the overhead trendline. Thus, with sustained buying, the MATIC price may rise 80% higher to hit the $1.8 mark.
Polkadot(DOT)
Source- Tradingview
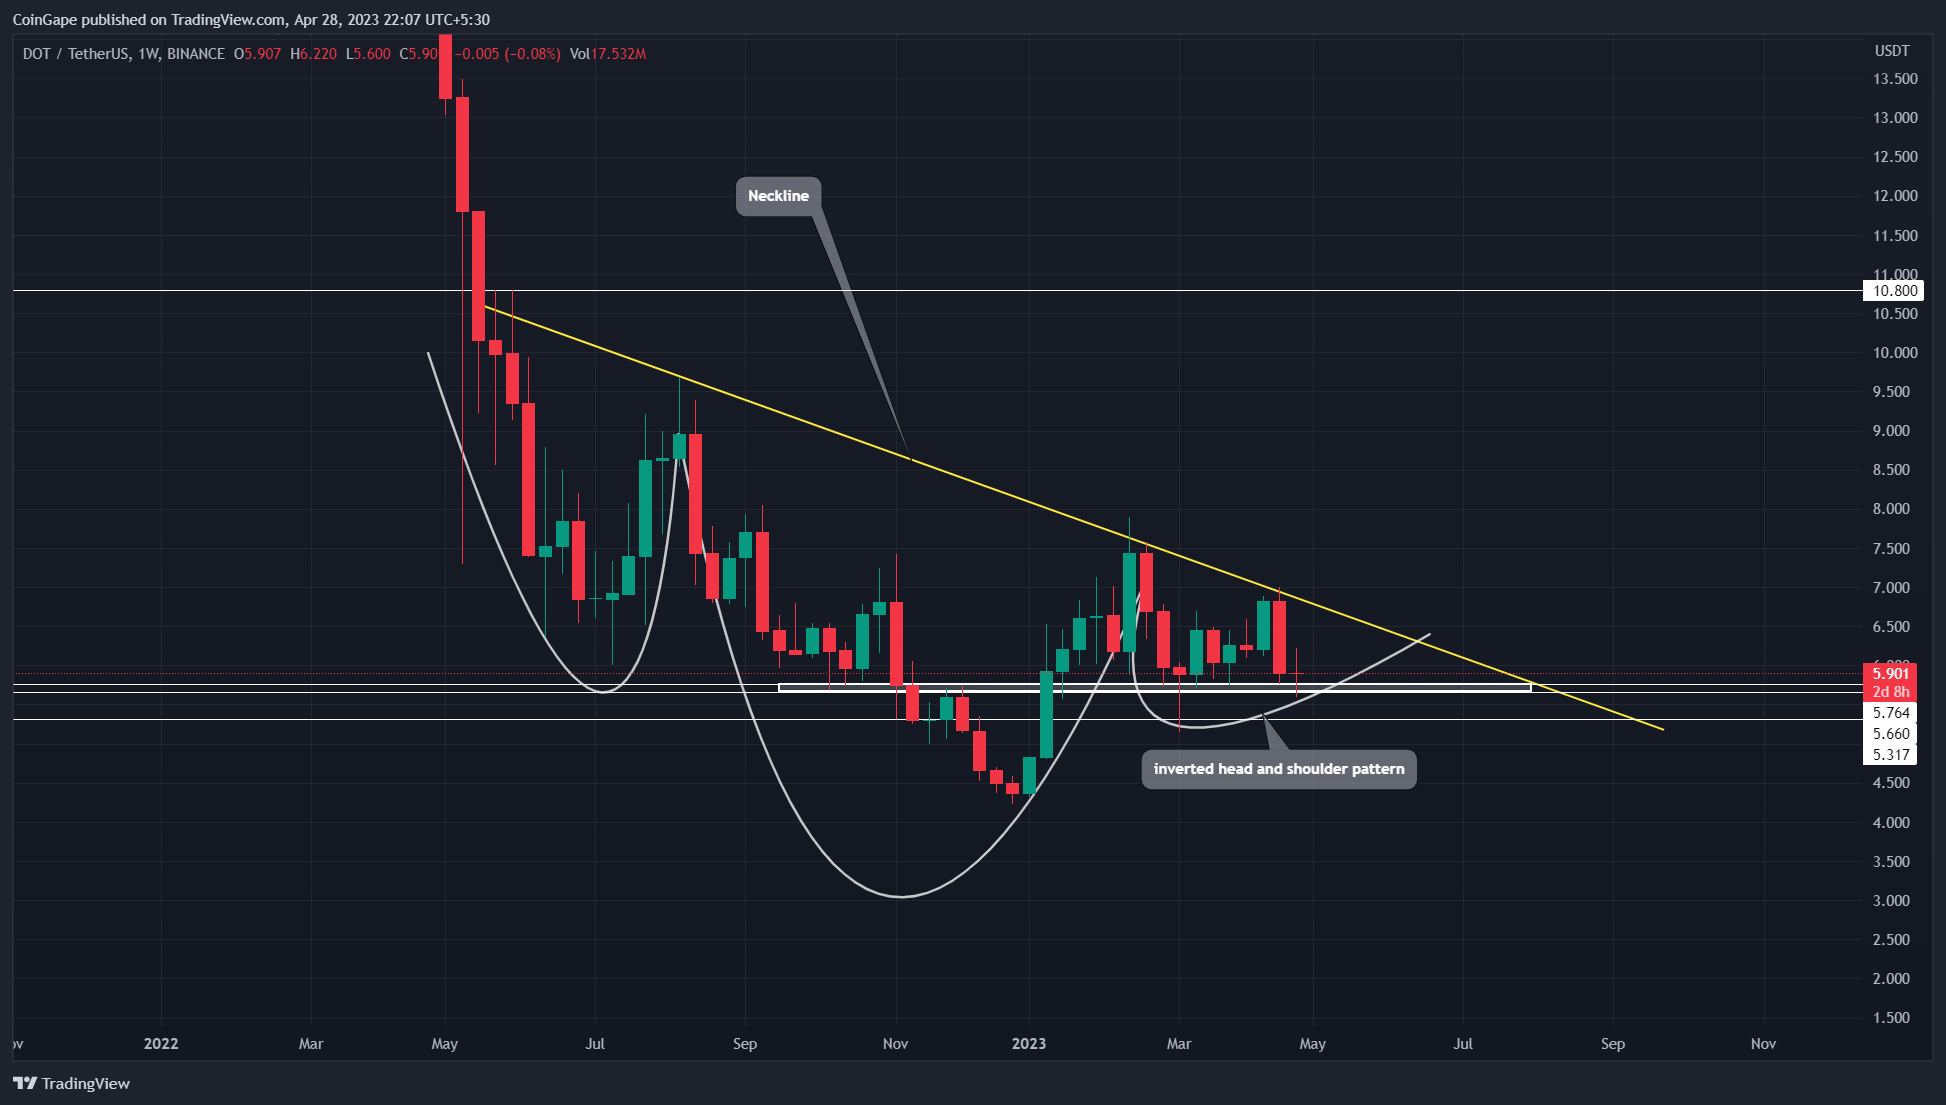
In the weekly time frame chart, the Polkadot coin shows the formation of an inverted head and shoulder pattern. This famous reversal pattern consists of a long swing low, the head, and two narrow lows called the shoulders.
As of now, the DOT price trades at the $5.86 mark and forms the right shoulder of the pattern as shown in the above. If altcoin manages to sustain above the $5.6 or $5.3 support, the buyers will likely surge the prices 10-12% higher to hit the key neckline trendline.
A potential breakout from this trendline will signal trend reversal and prepare Polkadot for a massive rally. The post-breakout rally could surge the prices 80-82% higher and hit the $10.8 mark.
Cosmos(ATOM)
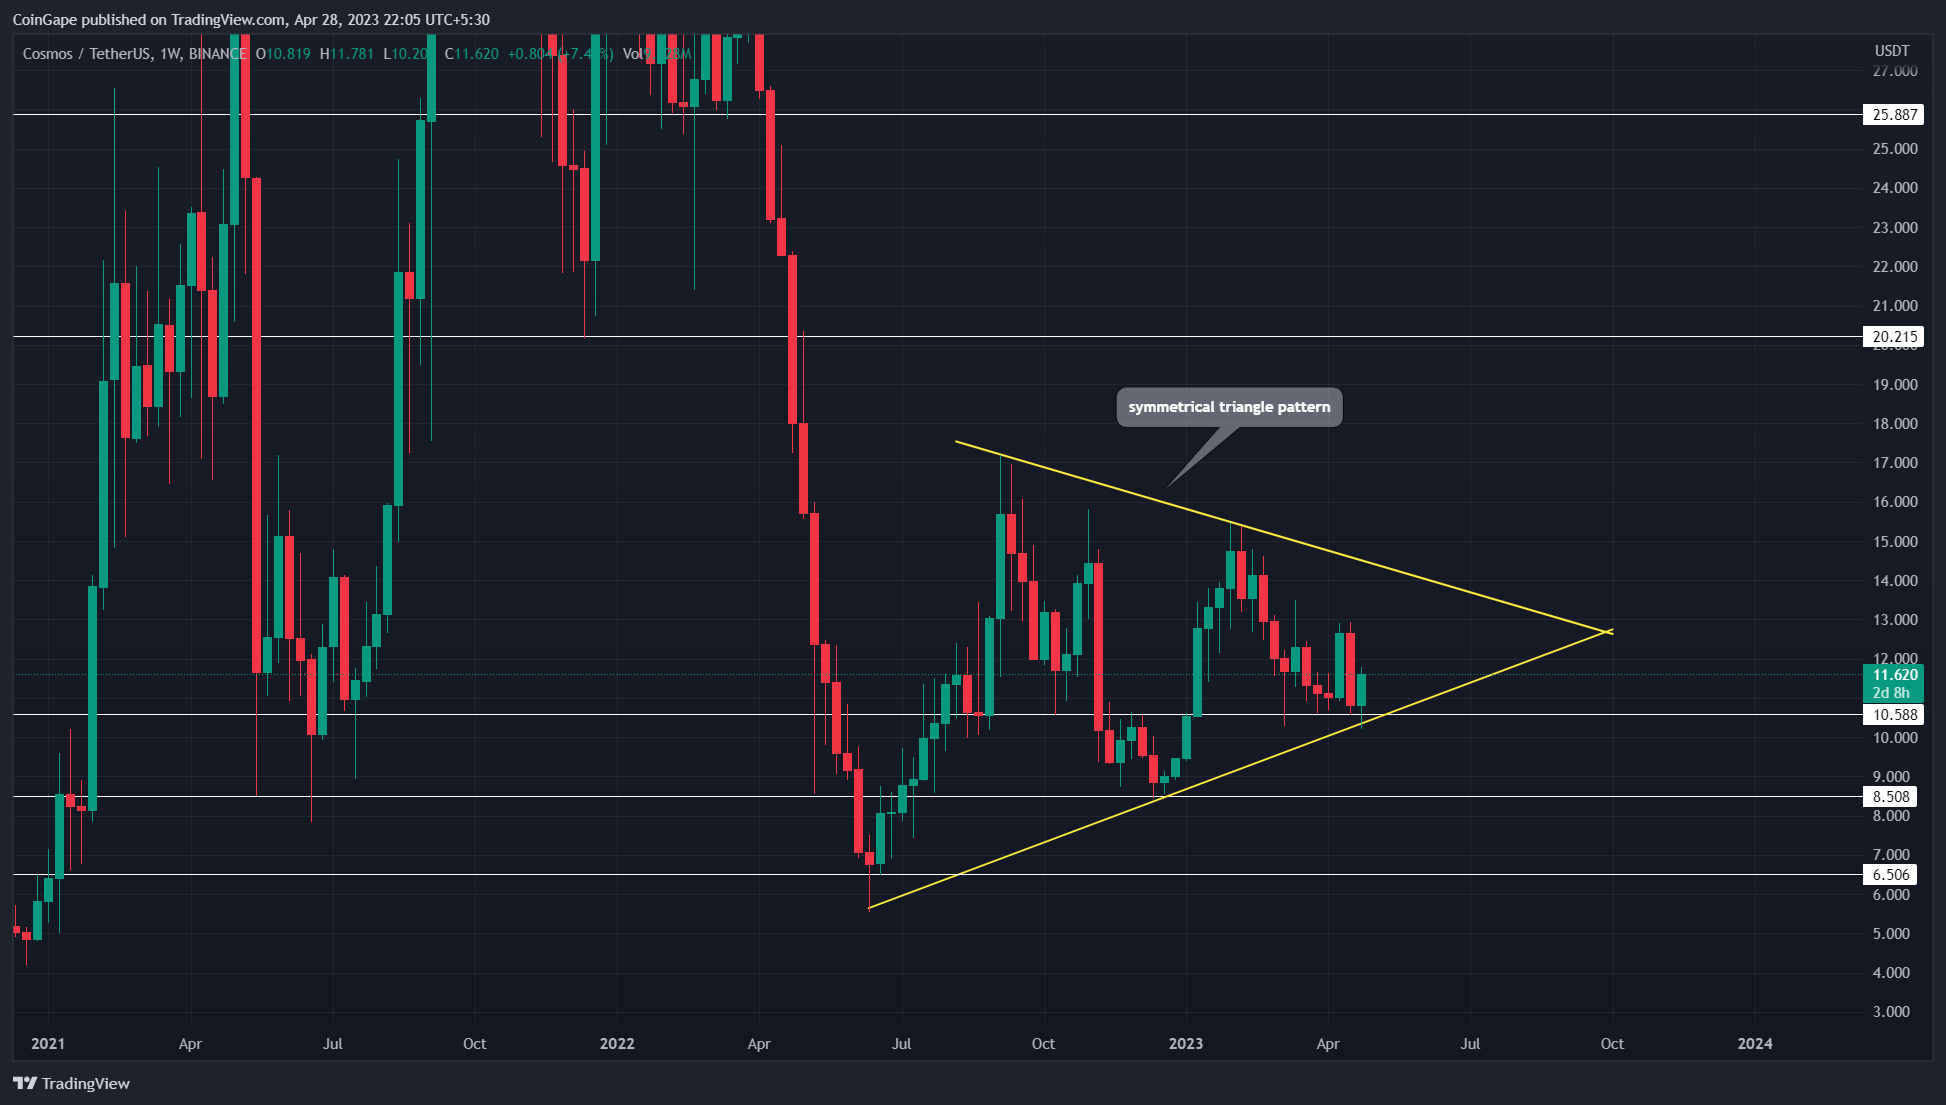
Source- Tradingview
For the past ten months, the Cosmos coin price has been moving sideways in response to a symmetrical triangle pattern. The coin price bounced from the pattern’s support trendline at least twice indicating the traders strictly respect this pattern and may do the same for its potential rally.
By press time, the ATOM price traded at the $11.69 mark and has recently bounced back from the pattern’s support trendline. This bullish reversal triggers a bull cycle with the pattern and may surge the coin price by around 20% to hit the overhead trendline.
Anyhow, a breakout from either of the trendlines will determine the direction of future trends. A potential breakout of the above trendline may drive the prices to a high of $25.8.
Share this article on:
advertisement
The presented content may include the personal opinion of the author and is subject to market condition. Do your market research before investing in cryptocurrencies. The author or the publication does not hold any responsibility for your personal financial loss.
- SEO Powered Content & PR Distribution. Get Amplified Today.
- PlatoAiStream. Web3 Data Intelligence. Knowledge Amplified. Access Here.
- Minting the Future w Adryenn Ashley. Access Here.
- Source: https://coingape.com/markets/planning-to-buy-dip-top-5-cryptocurrencies-testing-key-support/
- :has
- :is
- :not
- $UP
- 1
- 10
- 12
- 14
- 20
- 7
- 8
- 9
- 98
- a
- above
- accelerate
- Accumulate
- Ad
- ago
- aligned
- allows
- also
- Altcoin
- am
- Amid
- an
- and
- any
- April
- ARE
- around
- article
- AS
- asset
- At
- atom
- ATOM price
- author
- avatar
- back
- banner
- Beauty
- been
- before
- blockchain
- breakout
- Brian
- bull
- Bull Run
- Bullish
- buy
- buyers
- Buying
- by
- called
- carrying
- Chart
- Coin
- Coingape
- COM
- condition
- conditions
- considered
- content
- continue
- correction phase
- Cosmos
- could
- crypto
- Crypto Market
- cryptocurrencies
- cryptocurrency
- Currently
- cycle
- daily
- decisive
- Determine
- different
- Dip
- direction
- do
- does
- DOT
- drive
- dynamic
- Early
- either
- encourages
- Entertainment
- Ether (ETH)
- Failed
- famous
- Fashion
- Favorite
- finance
- financial
- follow
- followed
- For
- formation
- forms
- FRAME
- fresh
- from
- Furthermore
- future
- Gain
- grab
- Have
- head
- healthy
- High
- higher
- Hit
- hold
- HOURS
- HTTPS
- i
- ideal
- if
- in
- include
- Including
- increasing
- indicate
- indicates
- indicating
- influence
- interested
- investing
- IT
- ITS
- journalism
- jpg
- Key
- Last
- Level
- likely
- local
- Long
- loss
- Low
- Lows
- major
- Majority
- manages
- mark
- Market
- market research
- market sentiment
- massive
- Matic
- MATIC price
- max-width
- May..
- Momentum
- months
- most
- moving
- Near
- New
- now
- of
- offered
- offering
- on
- ongoing
- Opinion
- opportunities
- Opportunity
- or
- out
- participants
- past
- Pattern
- personal
- phase
- pioneer
- planning
- plato
- Plato Data Intelligence
- PlatoData
- plugin
- Polkadot
- potential
- potential recovery
- Prepare
- presented
- press
- pressure
- price
- Prices
- Publication
- pullback
- rallies
- rally
- reach
- Read
- recent
- recently
- recovery
- research
- Resistance
- respect
- response
- responsibility
- retracement
- Reversal
- riding
- Rise
- Run
- same
- sell-off
- Selling
- sentiment
- Share
- shifted
- should
- shown
- Shows
- sideways
- sign
- Signal
- significant
- SOL
- SOL Price
- Solana
- Solana Price
- subject
- suitable
- support
- surge
- Swing
- temporary
- ten
- Testing
- The
- The Weekly
- their
- this
- time
- to
- top
- top 5
- Topics
- traded
- Traders
- trades
- TradingView
- Trend
- trending
- Trends
- Twice
- two
- under
- using
- variety
- wait
- Waiting
- weekly
- which
- will
- with
- witnessed
- working
- would
- written
- xrp
- XRP Price
- years
- Your
- zephyrnet