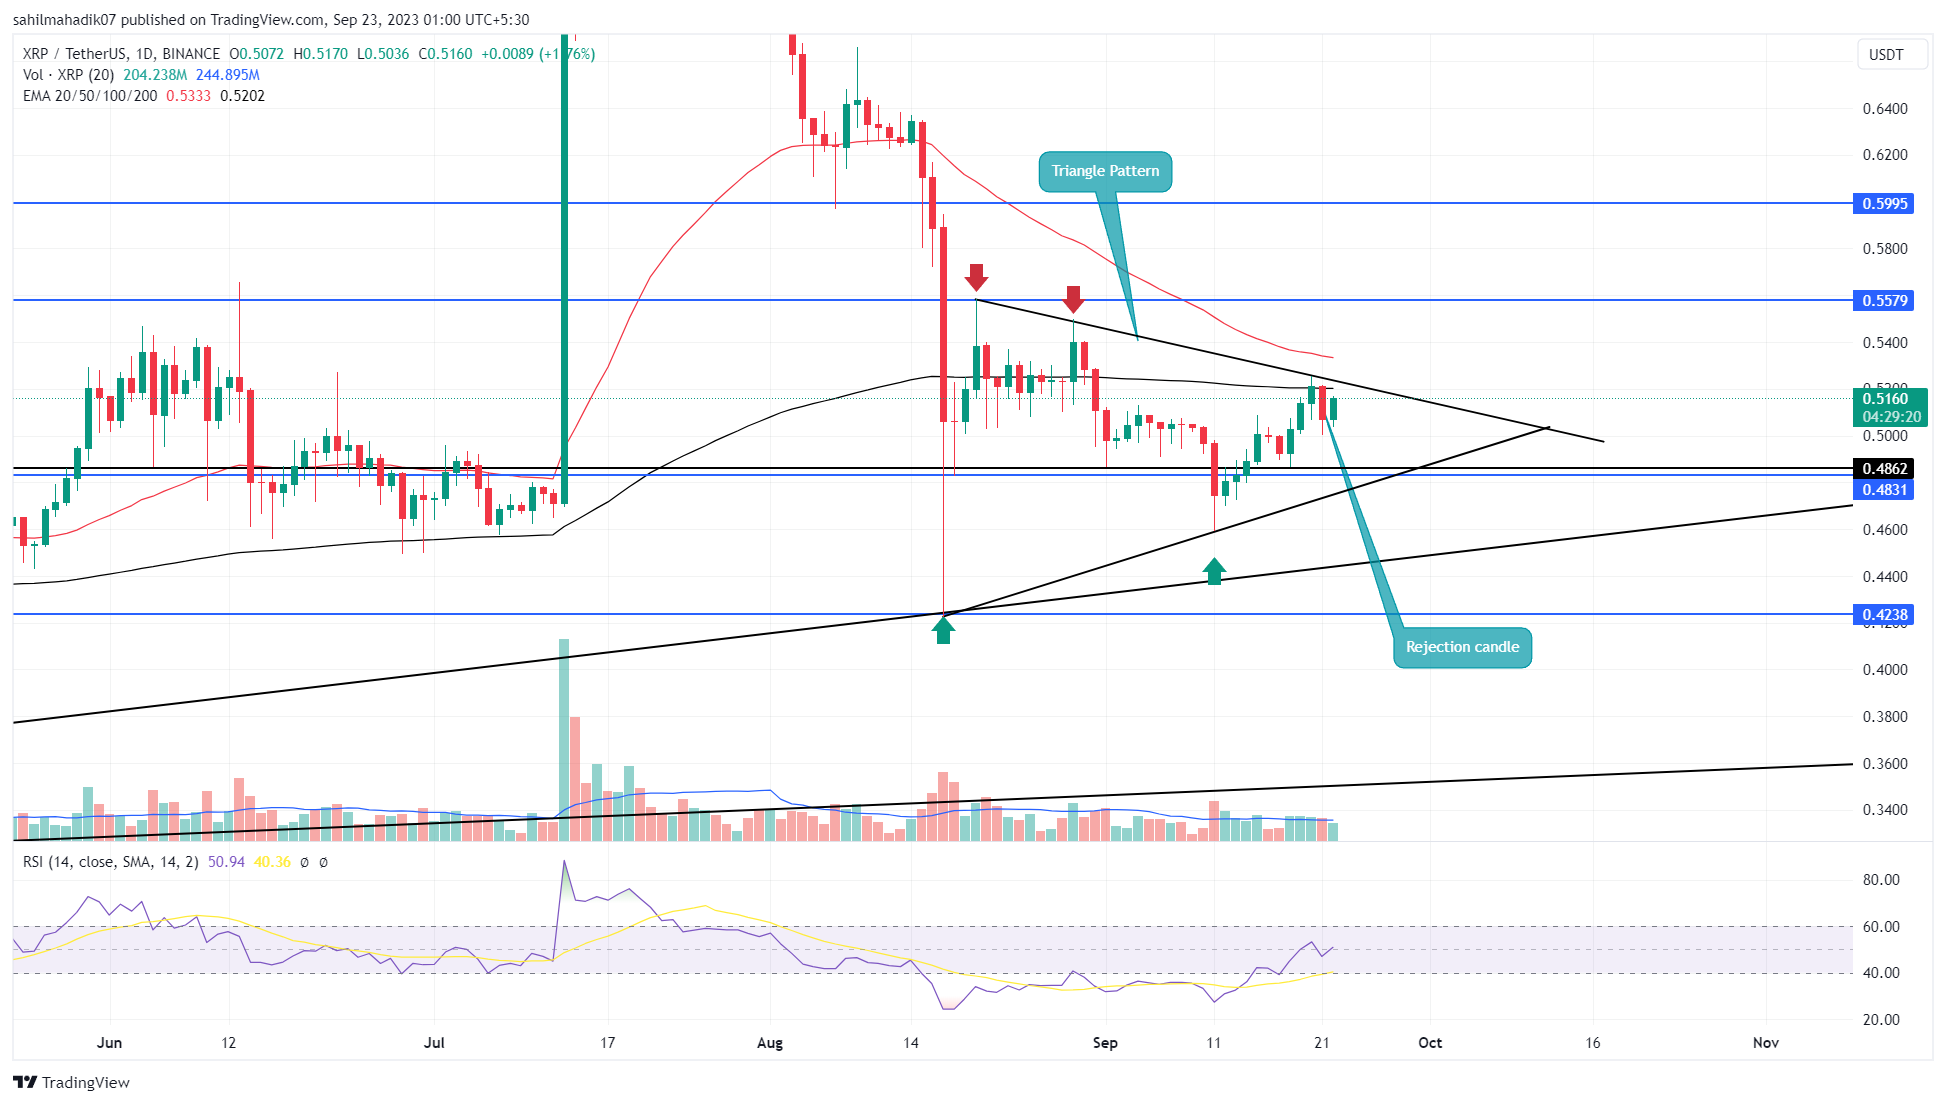
THe XRP price will prolong the sideways trend until the two trendlines are intact.
<!--Published 10 mins ago
Over the past fortnight, the XRP price value surged notably, leaping from $0.4592 to touch the $0.52 mark. This rise translated to a 14.5% increase but remained restrained within the boundaries of a symmetrical triangle pattern. This pattern has played a pivotal role in dictating altcoin’s price movement for the last month, suggesting its continued influence in the foreseeable future.
advertisement
<!-- markets_after_First_para-300x250 [async] if (!window.AdButler){(function(){var s = document.createElement("script"); s.async = true; s.type = "text/javascript";s.src = 'https://servedbyadbutler.com/app.js';var n = document.getElementsByTagName("script")[0]; n.parentNode.insertBefore(s, n);}());} var AdButler = AdButler || {}; AdButler.ads = AdButler.ads || []; var abkw = window.abkw || ''; var plc571012 = window.plc571012 || 0; document.write(''); AdButler.ads.push({handler: function(opt){ AdButler.register(180936, 571012, [300,250], 'placement_571012_'+opt.place, opt); }, opt: { place: plc571012++, keywords: abkw, domain: 'servedbyadbutler.com', click:'CLICK_MACRO_PLACEHOLDER' }}); -->Also Read: Whale Moves 120 Mln XRP From Bithumb, Bull Run Ahead?
XRP Price To Retest $0.55
- A breakout from either side of the triangle pattern could trigger a directional rally.
- The upper trendline may surge the price to $0.55
- The intraday trading volume in the XRP is $715 Million, indicating a 29% loss
Source: Tradingview
As the broader crypto market exhibited bearish tendencies, the XRP price couldn’t sustain its uptrend, faltering at the $0.525 resistance. This pullback marks the third time the price has recoiled from the triangle’s upper trendline, underscoring the pattern’s dominance over this asset.
The daily charts further substantiate this bearish sentiment by revealing an ‘Evening Star’ pattern at the resistance, a classic precursor to potential downtrends. If sellers continue to dominate the market, the XRP price might decline by around 6%, pushing its price down to the $0.485 level, thus retesting the triangle’s lower boundary.
As long as XRP oscillates between these trendlines, its price might remain range-bound.
Is $0.45 Next?
Historically, symmetrical triangles are viewed as continuation patterns. Given the trend and Epattern dynamics, it seems XRP might lean towards breaching the triangle’s lower support. Should this breach transpire, the amplified selling pressure could push the coin price further down towards the $0.45 support, with the subsequent target being the $0.42 level.
advertisement
The presented content may include the personal opinion of the author and is subject to market condition. Do your market research before investing in cryptocurrencies. The author or the publication does not hold any responsibility for your personal financial loss.
- SEO Powered Content & PR Distribution. Get Amplified Today.
- PlatoData.Network Vertical Generative Ai. Empower Yourself. Access Here.
- PlatoAiStream. Web3 Intelligence. Knowledge Amplified. Access Here.
- PlatoESG. Carbon, CleanTech, Energy, Environment, Solar, Waste Management. Access Here.
- PlatoHealth. Biotech and Clinical Trials Intelligence. Access Here.
- Source: https://coingape.com/markets/xrp-price-prediction-will-xrp-lose-0-5-mark-in-september/
- :has
- :is
- :not
- :where
- 1
- 10
- 12
- 13
- 14
- 150
- 200
- 250
- 300
- 40
- 52
- 7
- 72
- 9
- a
- Ad
- Ads
- against
- ago
- ahead
- Amplified
- an
- analysis
- and
- any
- ARE
- armed
- around
- article
- AS
- asset
- Assets
- At
- author
- avatar
- average
- bearish
- before
- being
- between
- Bithumb
- blockchain
- Bonus
- boundaries
- breach
- breakout
- broader
- bull
- Bull Run
- but
- buyers
- by
- Charts
- classic
- click
- Coin
- Coingape
- COM
- condition
- content
- continuation
- continue
- continued
- continues
- control
- could
- crypto
- Crypto Market
- cryptocurrencies
- cryptocurrency
- daily
- data
- Decline
- dedicated
- do
- document
- does
- domain
- Dominance
- dominate
- down
- drawn
- driven
- dynamics
- either
- embraced
- emerging
- Ether (ETH)
- experience
- explore
- eye
- financial
- Financial Instruments
- For
- foreseeable
- formation
- from
- further
- future
- Gain
- given
- grasp
- he
- High
- higher
- his
- hold
- http
- HTTPS
- if
- in
- include
- Increase
- index
- indicates
- indicating
- Indicator
- Indices
- influence
- instruments
- investing
- IT
- ITS
- keywords
- Last
- Level
- Long
- lose
- loss
- Low
- lower
- mark
- Market
- market research
- Markets
- May..
- might
- million
- mln
- Month
- movement
- movements
- moves
- moving
- moving average
- next
- notably
- of
- Offers
- on
- Opinion
- opportunities
- or
- over
- passion
- past
- Pattern
- patterns
- personal
- photo
- PHP
- pivotal
- Place
- plato
- Plato Data Intelligence
- PlatoData
- played
- plugin
- potential
- precursor
- prediction
- presented
- pressure
- price
- Price Prediction
- Publication
- pullback
- Push
- Pushing
- rally
- Read
- realm
- reflecting
- remain
- remained
- research
- Resistance
- responsibility
- revealing
- Rise
- Role
- Run
- s
- script
- seems
- Sellers
- Selling
- sentiment
- September
- Share
- should
- side
- sideways
- solid
- strength
- strong
- subject
- subsequent
- support
- surge
- Surged
- Symmetrical Triangle
- Target
- Technical
- Technical Analysis
- that
- The
- These
- Third
- this
- three
- Thus
- time
- to
- top
- touch
- towards
- trader
- Trading
- trading volume
- TradingView
- Trend
- trigger
- true
- two
- type
- until
- uptrend
- value
- viewed
- volume
- W3
- will
- window
- with
- within
- xrp
- XRP Price
- XRP price prediction
- years
- Your
- zephyrnet