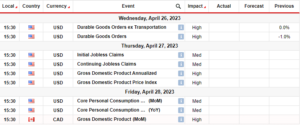
- Consumer confidence, GDP, and initial jobless claims indicated US economic strength.
- The FOMC meeting during the week led to a rate hike, supporting the dollar.
- The dollar reversed some gains on Friday when core PCE data pointed to further easing in inflation.
The AUD/USD weekly forecast is bearish as dollar strength will likely continue amid signs of a resilient economy.
Ups and downs of AUD/USD
Aussie had a bearish week characterized by dollar strength. Most major events for the week came from the US, leaving the Australian dollar at the mercy of the US dollar. Notably, data from the US last week pointed to a resilient economy.
-Are you looking for the best CFD broker? Check our detailed guide-
Consumer confidence, GDP, and initial jobless claims all indicated economic strength. Consequently, the dollar rose, pushing AUD/USD lower.
Moreover, the FOMC meeting during the week led to a rate hike, further supporting the dollar. However, there is uncertainty regarding future Fed moves. Finally, the dollar reversed some gains on Friday when core PCE data pointed to further easing in inflation.
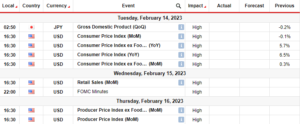
Next week’s key events for AUD/USD
A slim majority of economists predict that the Reserve Bank of Australia will raise interest rates by a quarter percentage point on Tuesday. However, after this anticipated hike, the RBA is expected to pause for the remainder of the year. This decision is because inflation exceeds the target, remaining well above the desired range.
Despite the RBA raising rates by 400 basis points since May 2022, inflation remained at 6.0% in the last quarter.
In light of this, even with a record-low unemployment rate and a rebound in Australia’s housing prices, the RBA believes it is necessary to increase base borrowing costs further.
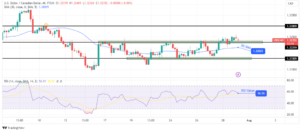
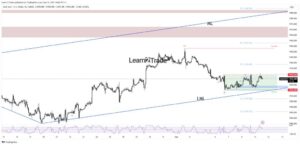
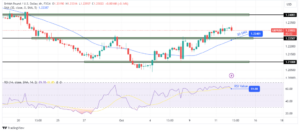
AUD/USD weekly technical forecast: Bearish dominance amid lateral price movement.

The daily chart’s bias for AUD/USD is bearish because the price is below the 22-SMA with the RSI under 50. This indicates bearish control. However, the price moves sideways on a larger scale, chopping through the 22-SMA. At the same time, the RSI is chopping through the pivotal 50-mark, showing a ranging market.
-If you are interested in guaranteed stop-loss forex brokers, check our detailed guide-
Currently, the price trades with the closest support at 0.6601 and resistance at 0.6801. Since bears are stronger in the short term, the price will likely soon retest the 0.6601 support. A break below this level would lead to a retest of the 0.6500 support level.
Looking to trade forex now? Invest at eToro!
68% of retail investor accounts lose money when trading CFDs with this provider. You should consider whether you can afford to take the high risk of losing your money
- SEO Powered Content & PR Distribution. Get Amplified Today.
- PlatoData.Network Vertical Generative Ai. Empower Yourself. Access Here.
- PlatoAiStream. Web3 Intelligence. Knowledge Amplified. Access Here.
- PlatoESG. Automotive / EVs, Carbon, CleanTech, Energy, Environment, Solar, Waste Management. Access Here.
- BlockOffsets. Modernizing Environmental Offset Ownership. Access Here.
- Source: https://www.forexcrunch.com/aud-usd-weekly-forecast-upbeat-us-data-capping-gains/
- :is
- 1
- 167
- 2022
- 30
- 50
- a
- above
- Accounts
- After
- All
- Amid
- and
- Anticipated
- ARE
- AS
- At
- AUD/USD
- Australia
- Australian
- Australian dollar
- Bank
- base
- basis
- bearish
- Bears
- because
- believes
- below
- BEST
- bias
- Borrowing
- Break
- brokers
- by
- came
- CAN
- CFDs
- characterized
- check
- chopping
- claims
- confidence
- Consequently
- Consider
- Container
- continue
- control
- Core
- Costs
- daily
- data
- decision
- desired
- detailed
- Dollar
- Dominance
- downs
- during
- easing
- Economic
- economists
- economy
- Even
- events
- exceeds
- expected
- Fed
- Finally
- FOMC
- For
- Forecast
- forex
- Forex Brokers
- Friday
- from
- further
- future
- Gains
- GDP
- had
- High
- Hike
- housing
- However
- HTTPS
- in
- Increase
- indicated
- indicates
- inflation
- initial
- interest
- Interest Rates
- interested
- Invest
- investor
- IT
- jobless claims
- Key
- larger
- Last
- lead
- leaving
- Led
- Level
- light
- likely
- looking
- lose
- losing
- lower
- major
- Majority
- Market
- max-width
- May..
- meeting
- money
- most
- movement
- moves
- necessary
- notably
- now
- of
- on
- our
- pause
- pce
- percentage
- pivotal
- plato
- Plato Data Intelligence
- PlatoData
- Point
- points
- predict
- price
- Prices
- provider
- Pushing
- Quarter
- raise
- raising
- range
- ranging
- Rate
- Rate Hike
- Rates
- RBA
- rebound
- regarding
- remained
- remaining
- Reserve
- reserve bank
- reserve bank of australia
- resilient
- Resistance
- retail
- Risk
- ROSE
- ROW
- rsi
- same
- Scale
- Short
- should
- showing
- sideways
- Signs
- since
- some
- Soon
- strength
- stronger
- support
- support level
- Supporting
- SVG
- Take
- Target
- Technical
- term
- that
- The
- There.
- this
- Through
- time
- to
- trade
- trades
- Trading
- Tuesday
- Uncertainty
- under
- unemployment
- unemployment rate
- us
- US Dollar
- week
- weekly
- WELL
- when
- whether
- will
- with
- would
- year
- you
- Your
- zephyrnet