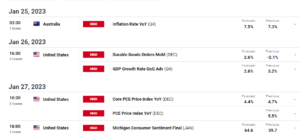
- Australia’s consumer price index rose at an annual pace of 4.3% in November.
- The soft inflation reinforced the belief that there would be no need for further increases in interest rates.
- Fed funds futures suggest a 64% probability of the Fed easing in March.
Despite signs of easing inflation in Australia, Wednesday’s AUD/USD forecast leans slightly bullish as the currency had little reaction to the news. In November, Australian consumer price inflation hit a nearly two-year low, with a big slowdown in core inflation.
–Are you interested in learning more about MT5 brokers? Check our detailed guide-
According to data on Wednesday, the consumer price index rose at an annual pace of 4.3% in November. It decreased from October’s 4.9% and was below the expected 4.4%. Meanwhile, the trimmed mean, a measure of core inflation, dropped from 5.3% in October to an annual rate of 4.6% in November.
As a result, the soft outcome reinforced the belief that there would be no need for further increases in interest rates.
On the other hand, in the US, the Fed surprised markets in December with a dovish stance, projecting 75 basis points (bps) of rate cuts in 2024. As a result, it heightened easing expectations, with traders initially anticipating up to 160 bps of cuts. However, the market has since changed, pricing in 140 bps of cuts for the year.
Furthermore, Fed funds futures suggest a 64% probability of the Fed easing in March, down from 80% a week earlier.
Moreover, traders are closely monitoring Thursday’s upcoming US consumer price index report to assess the likelihood of a rate cut in March. Experts expect a 0.2% increase in headline inflation for the month and a 3.2% rise annually.
AUD/USD key events today
Investors will keep digesting Australia’s inflation data as no more key economic reports are scheduled for today.
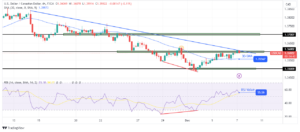
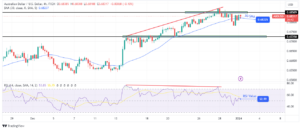
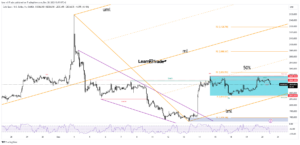
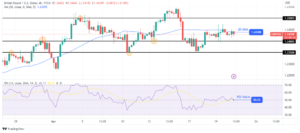
AUD/USD technical forecast: Price trades in a triangle pattern after a bearish leg

On the technical side, AUD/USD trades in a triangle after a bearish leg that paused at the 0.6674 key support level. The bias is bearish as the price has stayed below the 30-SMA since bears took control. Moreover, the RSI has respected the pivotal 50 level as resistance, staying in bearish territory.
–Are you interested in learning more about forex signals telegram groups? Check our detailed guide-
However, inside the triangle, the price has rebounded to the 30-SMA. Because bears are in control, the price will likely respect this resistance level and break out of the triangle and the 0.6674 support level. The price might then make another bearish leg, dropping to the 0.6550 support level.
Looking to trade forex now? Invest at eToro!
68% of retail investor accounts lose money when trading CFDs with this provider. You should consider whether you can afford to take the high risk of losing your money
- SEO Powered Content & PR Distribution. Get Amplified Today.
- PlatoData.Network Vertical Generative Ai. Empower Yourself. Access Here.
- PlatoAiStream. Web3 Intelligence. Knowledge Amplified. Access Here.
- PlatoESG. Carbon, CleanTech, Energy, Environment, Solar, Waste Management. Access Here.
- PlatoHealth. Biotech and Clinical Trials Intelligence. Access Here.
- Source: https://www.forexcrunch.com/blog/2024/01/10/aud-usd-forecast-australian-inflation-reaches-two-year-lows/
- :has
- :is
- $UP
- 1
- 160
- 2%
- 2024
- 50
- 75
- 75 basis points
- a
- About
- Accounts
- After
- an
- and
- annual
- Annually
- Another
- anticipating
- ARE
- AS
- assess
- At
- AUD/USD
- Australia
- Australian
- Australian Inflation
- basis
- BE
- bearish
- Bears
- because
- belief
- below
- bias
- Big
- Break
- break out
- Bullish
- CAN
- CFDs
- changed
- check
- closely
- Consider
- consumer
- consumer price index
- control
- Core
- core inflation
- Currency
- Cut
- cuts
- data
- December
- decreased
- detailed
- Dovish
- down
- dropped
- Dropping
- Earlier
- easing
- Economic
- events
- expect
- expectations
- expected
- experts
- Fed
- For
- Forecast
- forex
- from
- funds
- further
- Futures
- had
- hand
- headline
- heightened
- High
- Hit
- However
- HTTPS
- in
- Increase
- Increases
- index
- inflation
- initially
- inside
- interest
- Interest Rates
- interested
- Invest
- investor
- IT
- Keep
- Key
- learning
- Level
- likelihood
- likely
- little
- lose
- losing
- Low
- Lows
- make
- March
- Market
- Markets
- max-width
- mean
- Meanwhile
- measure
- might
- money
- monitoring
- Month
- more
- Moreover
- nearly
- Need
- news
- no
- November
- now
- october
- of
- on
- Other
- our
- out
- Outcome
- Pace
- Pattern
- paused
- pivotal
- plato
- Plato Data Intelligence
- PlatoData
- points
- price
- pricing
- probability
- provider
- Rate
- Rates
- Reaches
- reaction
- report
- Reports
- Resistance
- respect
- respected
- result
- retail
- Rise
- Risk
- ROSE
- rsi
- scheduled
- should
- side
- signals
- Signs
- since
- Slowdown
- Soft
- stance
- stayed
- staying
- suggest
- support
- support level
- surprised
- Take
- Technical
- Telegram
- territory
- that
- The
- the Fed
- then
- There.
- this
- to
- today
- took
- trade
- Traders
- trades
- Trading
- upcoming
- us
- was
- Wednesday
- week
- when
- whether
- will
- with
- would
- year
- you
- Your
- zephyrnet