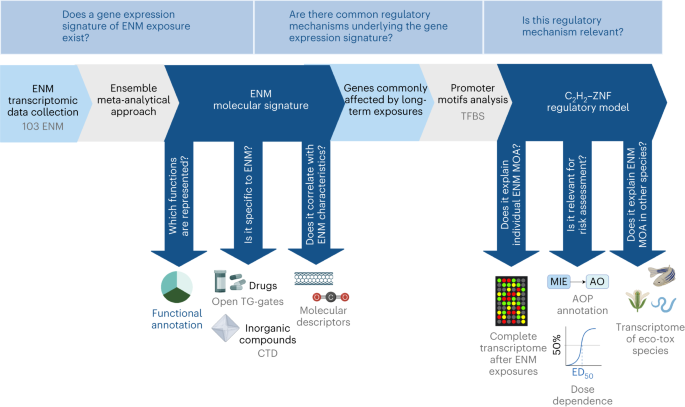
Data collection and pre-processing of nanomaterial datasets
The meta-analysis of ENMs toxicogenomics studies in vitro and in vivo can identify common molecular MOA independent from the biological system under evaluation. To this end, we implemented a meta-analysis of 66 transcriptomic datasets derived from the public data collection curated by ref. 8 (https://zenodo.org/record/3949890#.YlPUri0RqH0), supplemented with data previously published in ref. 10 (GSE157266) and ref. 9 (GSE148705) (Supplementary Table 8). From the original collection, we excluded rats’ datasets and the ones based on old microarray platforms, as they shared little probes with the more recent versions (Supplementary Table 8).
The datasets GSE148705 and GSE157266 were pre-processed using the eUTOPIA software (version commit December 2021), as previously described8,65. Briefly, we filtered probes with a value higher than the 0.8 quantile against the negative control in at least 75% of the samples. Data were normalized between arrays using quantile normalization66. No batch correction was needed for the dataset GSE148705, while GSE157266 was corrected for technical variation associated with variables ‘dye’ and ‘slide’ using the ComBat method67. Finally, we used the limma package (version 3.52.4) to compute the gene expression difference between each exposure in the dataset and the corresponding controls, correcting the P value using the Benjamini–Hochberg procedure. The aggregated, normalized and corrected expression matrix was then exported with no additional filtering.
In this study, we selected all pairwise comparisons between time–dose exposures and their respective controls. The final dataset comprised 584 specific exposure conditions (treatment, exposure time and dose, and biological system) and 3,676 genes, ranging across various human and mouse tissues and cell types.
The pool of 3,676 genes represents the intersection of genes present in all the experiments, limiting the mouse–human conversion to 1:1 orthology relationships (that is, where both genes in the pair have only one ortholog in the other species). The ortholog genes were converted using the getLDS function of the biomaRt R package (version 2.52.0)68. All data are available in the online Zenodo repository (https://doi.org/10.5281/zenodo.7674574).
Collection and pre-processing of transcriptomics data for drug exposure and chemical compounds
To assess the specificity of the ENM signature, raw microarray data for 158 drugs was downloaded from the Open Toxicogenomics Project-Genomics Assisted Toxicity Evaluation System database69. We applied the same pipeline to the in vivo exposures of rats to three dose levels of each drug.
Raw data were imported into R using the justRMA function from the R library Affy (version 1.60.0)70. Probe annotation to Ensembl genes was performed by the custom annotation files rat2302rnensgcdf (v. 22.0.0), downloaded from the brain array website, leading to 12,153 genes. The expression values were quantile normalized by means of the normalizeQuantile function from the R limma library (version 3.52.4)66. Differential expression analysis was performed for each drug, for each combination of dose level and time point (1,839 comparisons). The analyses were performed comparing the treated samples to the matched control samples of the same time point. As a result, log2 fold changes, P values and adjusted P values (by means of the false discovery rate (FDR) correction) were retrieved for all genes for each comparison.
To make a comparable evaluation, we only selected genes that had been included in the meta-analysis rank. As for chemical compounds, we downloaded, from the CTD, 142 gene signatures of ionic and covalent compounds71. We discarded gene sets smaller than 15 and bigger than 1,000, as it would have altered the statistics of the test, as well as hydrocarbons, alcohols and ethers, as they are classified as organic. For each of the remaining gene sets, we performed a gene set enrichment analysis (GSEA) of the ENM-associated rank and considered a significance threshold of P value adjusted to 0.05.
Collection of ecotoxicological transcriptomics data
To test the translatability of our model to non-mammal species of eco-toxicological interest, we verified whether genes altered in response to ENM in other non-mammal species are regulated by C2H2–ZNF transcription factors. To this aim, we downloaded from the Gene Expression Omnibus (GEO) seven datasets covering 17 exposures to well-known eco-toxicological model organisms (D. rerio, C. elegans, E. albidus and A. thaliana) and report the lists of differentially expressed genes (GSE80461, GSE32521, GSE70509, GSE73427, GSE77148, GSE41333, GSE47662)11,51 (Supplementary Table 11). The genes have been used to perform promoter analysis as previously described for the discovery collection (compare with ‘Promoter analysis’).
Characterization of the 584 experimental conditions
From the initial collection, we identified 584 experimental conditions that are unique because of the biological system, ENM or experimental condition used. We manually annotated each experimental condition by curating the information in the original publications (Supplementary Table 3). First, we grouped samples according to the biological system and exposure setting. We also included the exposure duration by grouping samples into short, intermediate and long exposures. Different thresholds were defined for in vivo and in vitro. In detail, for in vitro experiments, exposures have been considered short at 24 h, intermediate between 24 and 72 h and long after 72 h, respectively, as we expected the (sub-)acute toxicity to be observed within the first days of the exposure. Indeed, ref. 72 recently reported that in vitro systems tested between 6 and 72 h reproduce a scenario accounting for acute toxicity assessment of chemicals.
For in vivo exposures, thresholds were 3 days (short), between 3 days and 1 month (intermediate) and more than 1 month (long-term). In the health chemical evaluation, the 28 day exposure Organisation for Economic Cooperation and Development protocols are considered as the preliminary tests to assess long-term toxicity, while chronic toxicity studies should have a length of 12 months73,74,75,76 (Supplementary Fig. 10).
As for doses, only nominal doses for each experiment were available. It is noteworthy that nominal doses are not comparable between the exposures, further complicated by the heterogeneity of the measuring units reported (Supplementary Fig. 2b). We investigated that the majority of the studies included here tested sub-toxic dose exposures via a semi-automatic pipeline to scan the original manuscripts. We retrieved all the PubMed Central identifiers of the original articles. When the experimental details were not available, we considered the cited protocol in its references.
We used the BioPython Entrez (version 1.81)77 api to retrieve the documents through the PubMed Central IDs. Finally, we parsed the resulting XML documents and searched the abstract and/or the whole article for keywords (Supplementary Table 8) referring to sub-toxic doses. Each positive result was returned with its context and manually validated. For a reduced number of datasets, the corresponding articles could not be retrieved automatically, so they were manually checked. We were able to find indications of sub-toxic doses in 47 out of 58 publications.
The nanomaterials used in the experiment were classified according to the chemical characteristics and the presence or absence of functionalized groups.
A panel of information was extracted from the original publications (when possible), covering crystal phase, purity, absence of endotoxins, coating, stabilizer and supplier information, as well as protocol information.
Finally, when characterized, data were reported regarding the nominal diameter, length and specific surface area; transmission electron microscopy diameter, width and length; Brunauer-Emmett-Teller surface area; number of walls; dynamic light scattering mean diameter and polydispersity index in water and medium; and zeta potential in water and medium.
Computation of molecular descriptors
A set of 159 ENM descriptors covering both molecular and electronic structure properties was computed. Liquid drop model molecular attributes78 are calculated assuming that ENM can be represented as a spherical drop, where elementary molecules are tightly packed, while the density of clusters is equal to the particle mass density78,79. We computed the Wigner–Seitz radius (rw), the number of ENMs in the analysed agglomerate (n), the number of surface elements (S), the surface–volume ratio (SV) and the aggregation parameter (AP)78. The Wigner–Seitz radius characterizes the minimum radius of interactions between individual molecules and is represented by equation (1):
$$r_{mathrm{w}} = left( {frac{{3M}}{{4pi rho N_{mathrm{A}}}}} right)^{frac{1}{3}}$$
(1)
where M is the molecular weight, ρ is mass density, and NA is the Avogadro constant.
The number of ENMs in the agglomerate (n) is represented using equation (2):
$$n = left( {frac{{r_0}}{r_{mathrm{w}}}} right)^3$$
(2)
where r0 is the radius of each ENM.
The number of surface elements (S) is represented by equation (3):
$$S = 4n^{ – frac{1}{3}}$$
(3)
where S describes the ratio of surface molecules to molecules in the volume (or surface ENMs in agglomerates).
The surface–volume ratio (SV) is represented using equation (4):
$$SV = frac{S}{{1 – S}}$$
(4)
where SV is the feature that describes the ratio of surface molecules to molecules in volume (or surface ENMs in agglomerates).
Size-dependent interfacial thickness (h) was calculated with equation (5)
$$h = 0.01 times (T – 273) times r^{0.35}$$
(5)
where r is the nominal size of the ENM and T is temperature80.
The ENM electronic structure descriptors were computed by density functional theory and semi-empirical quantum chemical methods, while the Hamaker constants were evaluated from atomistic force fields and a continuum method81,82. ENMs interact via long-range van der Waals interaction, which is a major contribution to calculating the adsorption energies of biomolecules in water. Therefore, Hamaker constants are evaluated to describe bio–nano interactions in water through an atomistic force field approach and via Lifschitz theory82. In the Lifschitz theory82 two materials are interacting through a medium; the Hamaker constant for the ENM and a biomolecule in water is calculated from optical parameters that are experimentally determined (Supplementary Table 13), while in the force field approach long-range dispersion interaction is calculated using the Lorentz–Berthelot rules for sigma (atom size) and epsilon (atom–atom interaction amplitude)83,84. For metal ENMs, we used CHARMM force field parameters85. For metal oxides and carbon ENMs as well as amino acids, lipids and sugars, the force fields are reported in ref. 86. Considering all atom–atom interactions between two molecular entities, the Hamaker constant is derived by an approximation of the combined sigma and epsilon dispersion parameters87. In this work, we also considered the interaction between two ENM pieces in water. The geometric structures of the bulk ENMs were optimized with density functional theory and the Perdew-Burke-Ernzerhof functional88 using the SIESTA code89. The band gaps were also calculated by PBE88, while the heat of formation, electronegativity, absolute hardness, dispersion energy per atom, dipole moment and static polarizability descriptors81 were obtained on the self-consistent field level through the semi-empirical code MOPAC (http://OpenMOPAC.net) using the PM6-D390 parametrization. Finally, ionization potentials, electron affinities, and the global electrophilicity index were computed through self-consistent charge calculations (ΔSCC calculation) for the electronic states of the neutral and ion ENMs via the GFN1-xTB parameterization of the GFN-xTB code91,92,93,94,95.
We further included a set of atomistic descriptors that are based on the chemical composition, potential energy, lattice energy, topology, size and force vectors96,97. Constitutional descriptors are the counts of atoms of different identity and/or location. Potential energy descriptors are derived from the force-field calculations, corresponding to the arithmetic means of the potential energies for specific atom types and/or locations in the ENM. Lattice energies are based on the same potential energies but presented as per metal oxide nominal units (MxOy) and describe the energy needed to rip away said unit from the ENM surface. The coordination number of atoms is defined as the count of the neighbouring atoms that lie inside the radius,
$$R = 1.2 times (R_{mathrm{M}};{mathrm{and}};R_{mathrm{O}})$$
(6)
where RM and RO are the ionic radii of metal and oxygen ions, respectively. A low coordination number indicates that some atoms have missing neighbours and thus makes the ENM more unstable. The size was derived from the actual calculated ENM diameter. The force vector lengths have been derived from the structure optimization. For example, to derive the average length (V) of the surface normal component of the force vector for a shell region atom, its coordinates (x, y, z), force vector components (fx, fy, fz) and distance from the centre of mass (d) are used:
$$V = frac{{(xf_x + yf_y + zf_z)}}{d}$$
(7)
Sample values for TiO2 (10 nm) are reported (Supplementary Table 14). For amorphous ENMs a multi-step procedure was used requiring the simulation of bulk metal or metal oxide materials above their melting temperature, the extraction of ENMs with the desired size and shape, and their subsequent cooling at the temperature of interest with a prescribed rate. Such a procedure has been applied to build spherical amorphous ENMs with the aid of the automated Enalos Demokritos KNIME nodes. All the data are hosted at the NanoPharos database (db.nanopharos.eu) and were converted into a ready-for-modelling format.
Meta-analysis implementation
We implemented a consensus of three algorithms for meta-analysis to prioritize the shared 3,676 genes.
As previously proposed98,99, our pipeline is based on the effect-size, P value-based and rank-product methods. Usually, meta-analysis frameworks are based on effect-size methods, assessing within- and between-study variations across multiple studies. These methods outperform others when there is large between-study variation and small sample sizes. To implement it, the ‘effect_sizes’ function from the esc R package (version 0.5.1) was used with the P-value argument and the ‘chi_esc’ function100. The Fisher’s sum of logs method combines individual P values. Fisher’s sum of logs method was implemented by using the ‘sumlog’ function of the R package metap (version 1.8), giving as input the P values of each gene101. Finally, the rank product is a non-parametric statistical method to combine differential gene expression analysis results from individual studies based on the within-study gene ranks. To this end, the genes in each experiment were ranked based on the relevance of their associated P values, and the ‘RP.advance’ function of the RankProd R package (version 3.24.0) was used to merge them via one-class analysis of the rank-product method102,103. This function allows combining data coming from different studies, such as in the case of datasets generated by different laboratories. For each method, a rank was generated. Finally, all the ranks were combined through the Borda function of the TopKlists R package (version 1.0.8)104. The final mean rank is reported in Supplementary Table 1.
GSEA and feature selection step
To select the most biologically relevant portion of the rank, we performed a GSEA of the meta-analysis rank on five databases (Wikipathways105, Gene Ontology106, Reactome107, Kyoto Encyclopedia of Genes and Genomes108 and MsigDB109). In each case, the ‘fgsea’ function from the fgsea R package (version 1.22.0) was used110. For each test, we identified the position of the rank having the highest peak value of cumulative enrichment statistics. We created a reduced representation of the meta-analysis gene rank by setting as a threshold the top 10th percentile of such values (1,873 genes).
Computation of the frequency score and hierarchical clustering
To find genes associated with in vitro and in vivo long-term exposures for each gene of the reduced meta-analysis rank, we calculated a frequency score as the percentage of samples in which the gene was statistically significant.
The genes were clustered according to the Euclidean distance of their frequency scores. The hierarchical clustering algorithm, with Ward linkage method, implemented into the ‘hclust’ function of the R package ‘stats’ (version 4.2.0) was used.
For each type of exposure system, we selected the cluster with the most frequently deregulated genes. To functionally annotate them, we performed a pathway enrichment analysis through the EnrichR online tool (accessed in 2021), using the MsigDB and Reactome databases107,109,111,112,113.
Computation of the molecular descriptors–gene expression correlation
To identify associations between ENM chemical properties and molecular alterations induced in cells and organisms by their exposure, the Pearson correlation coefficient was computed for each pair of gene and molecular descriptor, after a pre-processing step. In particular, a Winsorize function of the DescTools R package (version 0.99.43)114 was used to replace extreme values of log2 fold changes with less extreme ones. Moreover, a cube root transformation was applied to the molecular descriptor values.
As the molecular descriptor data layer contains missing data, the Pearson correlation was computed for the subset of samples where values were available.
For each descriptor the top 10% of the most correlated genes were selected. First, the gene sets were enriched against the Kyoto Encyclopedia of Genes and Genomes pathways by means of the FunMappOne tool (version commit December 2021)115. Only pathways with FDR-corrected P < 0.05 were considered significantly enriched. The molecular descriptors were further clustered in nine groups based on the Jaccard Index similarity of the shared enriched pathways. Lastly, the fgsea R package (version 1.22.0)110 was used to perform a GSEA analysis and identify the molecular descriptors whose set of associated genes is enriched on the top of the ranked list of genes identified with the meta-analysis approach. Only molecular descriptors with an adjusted P < 0.01 were selected.
Promoter analysis
For each gene in the subset of interest, the sequence of the promoter region [−500 bp, +100 bp] around the TSS was downloaded using the biomart package and the getSequence function in ‘coding_gene_flank’ mode68. In this modality the function returns the flanking region of the gene including the untranslated regions.
Motif discovery was conducted with the MEME software suite (version 5.5.1)116. The motif site distribution was set as any number of repetitions; the search was restricted to motifs ranging between 6 and 15 bases and the P-value threshold to 0.05.
For each result, the Factorbook database was interrogated to explore the TFBS (https://www.factorbook.org/). Factorbook is a transcription factor-centric web-based repository associated with ENCODE ChIP-seq data, as well as multiple databases of TFBSs. We selected the TFBS that best matches the query according to the tool.
For each organism (Homo sapiens and Mus musculus in the discovery set, and D. rerio, C. elegans, E. albidus and A. thaliana in the eco-toxicological comparison) we annotated whether the TFBS would be recognized by a C2H2–ZNF member. To evaluate the statistical significance of C2H2–ZNF overrepresentation, we performed a Fisher test with the fisher.test function in the stats R package. We used as a background the set of non-redundant transcription factor binding profiles provided in the JASPAR database117. The contingency matrix was built by using the set of TFBS of the C2H2–ZNF family members and all the others, respectively.
Dual luciferase assay
BEAS-2B cells (ATCC, CRL-9606) were grown in BEGM (Lonza, CC-3170). Cells were cultivated in 75 cm2 culture flasks at 37 °C with a humidified atmosphere of 5% CO2. For all experiments, 500 µl of cells was seeded at a density of 3.75 × 10³ cells per ml in 48-well plates. Cells were then left to rest overnight before transfections. One hour before transfection, the media was replaced with 225 µl of fresh BEGM per well. Two vectors were used for transfection: human cytomegalovirus (CMV) (positive vector control) and the ZNF362, created with VectorBuilder (Supplementary Fig. 7b). Per well, 0.25 µg of DNA vector in Opti MEM reduced serum medium (Gibco, 31985062) was added 1:1 with Lipofectamine 3000 reagent 6% V/V (ThermoFisher Scientific, 15338030) and P3000 enhancer reagent 4% V/V in Opti MEM reduced serum medium (Gibco, 31985062). About 25 µl of this transfection solution was added per well and mixed by gentle agitation of the plate. Twenty-four hours post-transfection, cells were exposed to one of the following: NM401 (JRC MWCNTs-NM401-JRCNM04001) or carbon black (CB, Orion Engineered Carbons, Printex 90) nanomaterials at either low (20 µg ml−1) or high (100 µg ml−1) concentration; or nefazodone hydrochloride (Sigma-Aldrich, N5536) at low (25 µM) or high (50 µM) concentration. NM401 and CB nanomaterials were prepared according to the nanogenotox protocol (https://safenano.re.kr/download.do?SEQ=175). Briefly, in a glass vial, 0.5% of final stock volume of ethanol was added to the initial weighed nanomaterial powder; 0.05%W/V BSA-BEGM was added for a final stock concentration of 0.2 mg ml−1. The vial was then sonicated 2 times for 15 min in a water bath; this stock solution was then diluted in 0.05%W/V BSA-BEGM to create final solutions, and final solutions were sonicated for 15 min before addition to the wells. Vehicle control (VC) for nanomaterials was 0.05%W/V BSA-BEGM. Nefazodone hydrochloride was prepared in 0.05%W/V BSA-BEGM and DMSO (final DMSO concentration in well of 0.5%). VC for nefazodone hydrochloride was 0.5% DMSO in 0.05%W/V BSA-BEGM. Exposures were performed for 24 and 48 h.
The Dual-Glo luciferase Assay System (Promega, E2920) was used as per the manufacturer’s guidelines to measure firefly and renilla luciferase activity, on a Spark multiplate reader (Tecan).
There were three samples measured for each vector and vehicle control, for each exposure. The mean signal of three background wells (cells only) was used to subtract background from luciferase measurements. The firefly luciferase activity was normalized to renilla luciferase and power transformed. When present, outliers were removed with the boxplot function in R. The t-test was used to investigate the differences between the experimental and control samples.
Dose-dependent gene analysis
To verify if the C2H2–ZNF model can explain the dose-dependent portion of the ENM response, a dose–response analysis of 62 studies derived from 33 datasets (all initially included in the analysis but GSE146708) was performed following the strategy implemented in the BMDx tool (version commit February 2022)118. Briefly, multiple models were fitted, and the optimal model was selected as the one with the lowest Akaike information criterion. The effective doses (BMD, BMDL and BMDU) were estimated under the assumption of constant variance. The benchmark response was identified by means of the standard deviation approach with a benchmark response factor (BMRF) of 1.349, corresponding to a minimum of 10% difference with respect to the controls. Only genes with lack-of-fit P > 0.01 and with estimated benchmark dose (BMD), benchmark dose lower confidence limit (BMDL) and benchmark dose upper confidence limit (BMDU) values were deemed relevant. Genes with BMD or BMDU values higher than the highest exposure dose were removed. Furthermore, genes whose ratio between the predicted doses is higher than the suggested values (BMD/BMDL > 20, BMDU/BMD > 20 and BMDU/BMDL > 40) were removed from the analysis.
AOP enrichment analysis
To enrich key events and AOPs, we exploited the recently curated annotation from ref. 48. For each gene set, we performed an enrichment of the C2H2–ZNF targets as derived from ref. 119. For individual events, the significance threshold was set at P value adjusted to 0.05.
As for the complete AOPs, we first enriched as described the genes annotated to each pathway and discarded P values higher than 0.05. In a next step, we evaluated if at least one-third of the events contained in it passed the same threshold of significance (0.05).
Reporting summary
Further information on research design is available in the Nature Portfolio Reporting Summary linked to this article.
- SEO Powered Content & PR Distribution. Get Amplified Today.
- PlatoAiStream. Web3 Data Intelligence. Knowledge Amplified. Access Here.
- Minting the Future w Adryenn Ashley. Access Here.
- Buy and Sell Shares in PRE-IPO Companies with PREIPO®. Access Here.
- Source: https://www.nature.com/articles/s41565-023-01393-4
- :has
- :is
- :not
- :where
- ][p
- 000
- 1
- 10
- 100
- 102
- 107
- 11
- 110
- 116
- 12
- 13
- 14
- 15%
- 1994
- 1996
- 20
- 2011
- 2014
- 2015
- 2016
- 2017
- 2018
- 2019
- 2020
- 2021
- 2022
- 2023
- 22
- 23
- 24
- 27
- 28
- 40
- 49
- 50
- 500
- 66
- 67
- 7
- 70
- 72
- 77
- 8
- 84
- 9
- 98
- a
- Able
- About
- above
- Absolute
- ABSTRACT
- accessed
- According
- Accounting
- accurate
- across
- activity
- added
- addition
- Additional
- Adjusted
- adverse
- After
- against
- aggregation
- Aid
- aim
- AL
- algorithm
- algorithms
- All
- allows
- also
- altered
- an
- analysis
- Anchor
- and
- any
- api
- Application
- applied
- approach
- ARE
- AREA
- argument
- around
- Array
- article
- articles
- AS
- Assessing
- assessment
- associated
- associations
- assumption
- At
- Atmosphere
- atom
- Automated
- automatically
- available
- average
- away
- background
- BAILeY
- BAND
- based
- basic
- BE
- because
- been
- before
- Benchmark
- BEST
- between
- bigger
- binding
- biology
- Black
- BMC
- both
- BP
- Brain
- briefly
- broadly
- build
- built
- but
- by
- calculated
- calculating
- CAN
- carbon
- case
- CB
- CD
- Cells
- central
- centre
- CGI
- chain
- Changes
- characteristics
- characterized
- characterizes
- charge
- checked
- chemical
- chemicals
- chemistry
- chen
- cited
- classification
- classified
- click
- Cluster
- clustering
- code
- collaborative
- collection
- combat
- combination
- combine
- combined
- combines
- combining
- coming
- commit
- Common
- Communities
- comparable
- compare
- comparing
- comparison
- complete
- complicated
- component
- components
- comprehensive
- Comprised
- computation
- Compute
- concentration
- condition
- conditions
- conducted
- confidence
- Connecting
- Consensus
- considered
- considering
- consistent
- constant
- contains
- context
- Continuum
- contribution
- contributions
- control
- controls
- Conversion
- converted
- cooperation
- coordination
- corrected
- Correlation
- correlation coefficient
- Corresponding
- could
- COVALENT
- covering
- create
- created
- Crystal
- Culture
- curated
- curating
- custom
- data
- data integration
- Database
- databases
- datasets
- Davis
- day
- Days
- December
- december 2021
- deemed
- defined
- density
- Derived
- describe
- described
- Design
- desired
- detail
- details
- determined
- develop
- Development
- deviation
- Die
- difference
- differences
- different
- discover
- discovery
- Dispersion
- distance
- distribution
- dna
- do
- documents
- Drop
- drug
- Drugs
- duration
- dynamic
- dynamics
- e
- E&T
- each
- Economic
- ed
- effect
- Effective
- effects
- either
- Electronic
- elements
- end
- energy
- enrich
- enriched
- entities
- environmental
- equal
- estimated
- Ether (ETH)
- EUR
- evaluate
- evaluated
- evaluation
- events
- example
- excluded
- expanded
- expectation
- expected
- experiment
- experiments
- Explain
- exploited
- explore
- exposed
- Exposure
- expressed
- extraction
- extreme
- factor
- factors
- false
- family
- family members
- FAST
- Feature
- Features
- February
- field
- Fields
- Fig
- Files
- filtering
- final
- Finally
- Find
- First
- fitting
- Focus
- following
- For
- Force
- Forces
- format
- formation
- frameworks
- Frequency
- frequently
- fresh
- from
- function
- functional
- further
- Furthermore
- generated
- generation
- gentle
- Giving
- glass
- Global
- Group’s
- grown
- guidelines
- had
- Have
- having
- Health
- here
- High
- higher
- highest
- Hong
- hosted
- hour
- HOURS
- How
- http
- HTTPS
- human
- i
- identified
- identifies
- identify
- Identity
- ids
- if
- implement
- implemented
- in
- In other
- included
- Including
- independent
- index
- indicates
- indications
- individual
- information
- initial
- initially
- input
- Integrating
- integration
- interact
- interacting
- interaction
- interactions
- interactive
- interest
- Interface
- Intermediate
- intersection
- into
- investigate
- Ionic
- IT
- ITS
- Johnson
- Key
- knowledge
- large
- large-scale
- layer
- leading
- least
- left
- Length
- less
- Level
- levels
- Library
- light
- LIMIT
- LINK
- linked
- Liquid
- List
- Lists
- little
- location
- locations
- Long
- long-term
- Low
- lowest
- made
- major
- Majority
- make
- MAKES
- manually
- mapping
- Martin
- Mass
- matched
- material
- materials
- Matrix
- Matter
- mean
- means
- measure
- measurements
- measuring
- mechanisms
- Media
- medium
- member
- Members
- meme
- Merge
- Meta
- metal
- method
- methodologies
- methods
- Microscopy
- MILANO
- minimum
- missing
- mixed
- mixture
- ML
- model
- modeling
- models
- MOL
- molecular
- moment
- Month
- more
- Moreover
- most
- multiple
- Nanomaterials
- Nature
- Navigate
- needed
- negative
- net
- Neutral
- New
- next
- NIH
- no
- nodes
- normal
- noteworthy
- novel
- number
- obtained
- OECD
- of
- Old
- on
- ONE
- One-third
- ones
- online
- only
- Ontology
- open
- optimal
- optimization
- optimized
- or
- organic
- organisation
- original
- Other
- Others
- our
- out
- Outcome
- Outperform
- overnight
- Oxygen
- package
- packed
- panel
- parameter
- parameters
- particle
- particular
- passed
- patterns
- Peak
- pearson
- percentage
- perform
- phase
- physical
- Physics
- pieces
- pipeline
- Platforms
- plato
- Plato Data Intelligence
- PlatoData
- Point
- pool
- portfolio
- position
- positive
- possible
- potential
- power
- powers
- predicted
- predicting
- prepared
- presence
- present
- presented
- previously
- principles
- Prioritize
- probe
- PROC
- Product
- Profiles
- profiling
- properties
- protocol
- protocols
- provided
- public
- publications
- published
- Python
- Quantum
- ranging
- ranked
- ranks
- Rate
- ratio
- Raw
- RE
- Reader
- recent
- recently
- recognized
- Reduced
- references
- regarding
- region
- regions
- regulated
- regulatory
- Relationships
- relevance
- relevant
- remaining
- Removed
- repeated
- replace
- replaced
- report
- Reported
- Reporting
- repository
- representation
- represented
- represents
- research
- respect
- respective
- respectively
- response
- REST
- restricted
- result
- resulting
- Results
- returns
- robust
- root
- rules
- s
- Safety
- Said
- same
- Scala
- scan
- scenario
- SCI
- SCIENCES
- score
- Search
- selected
- selection
- Sequence
- Serum
- set
- Sets
- setting
- seven
- Shape
- shared
- Shell
- Short
- should
- side
- Sigma
- Signal
- Signatures
- significance
- significant
- significantly
- Simple
- simulation
- simultaneously
- site
- Size
- sizes
- small
- smaller
- So
- Soft
- Software
- solution
- Solutions
- some
- Source
- source code
- Space
- Spark
- specific
- specificity
- standard
- States
- statistical
- statistics
- stats
- Step
- stock
- Strategy
- structure
- studies
- Study
- subsequent
- such
- suite
- Surface
- system
- Systems
- table
- targets
- Technical
- test
- tests
- than
- that
- The
- the information
- their
- Them
- then
- There.
- therefore
- These
- they
- this
- three
- threshold
- Through
- tightly
- time
- times
- tissues
- Titanium
- to
- tool
- tools
- top
- towards
- Transformation
- transformed
- treatment
- two
- type
- types
- under
- unique
- unit
- units
- Update
- used
- using
- usually
- v1
- validated
- value
- value-based
- Values
- various
- VC
- vehicle
- verified
- verify
- version
- via
- viruses
- vivo
- volume
- W
- was
- Water
- we
- web
- web server
- web-based
- Website
- weight
- weiss
- WELL
- well-known
- Wells
- were
- when
- whether
- which
- while
- whole
- with
- within
- Work
- would
- XML
- zephyrnet
- Zeta


