Published 12 hours ago
The ongoing recovery in Stacks coin prices hit a minor roadblock at $1.3 and triggered a new correction phase Though the retracement phase took a considerable chuck from the prior recovery this correction could assist buyers to recuperate the bullish momentum and shows price sustainability at a higher price. Should you grab the pullback opportunity now?
advertisement
Bullish Pattern in the Weekly Chart.
Source- Tradingview
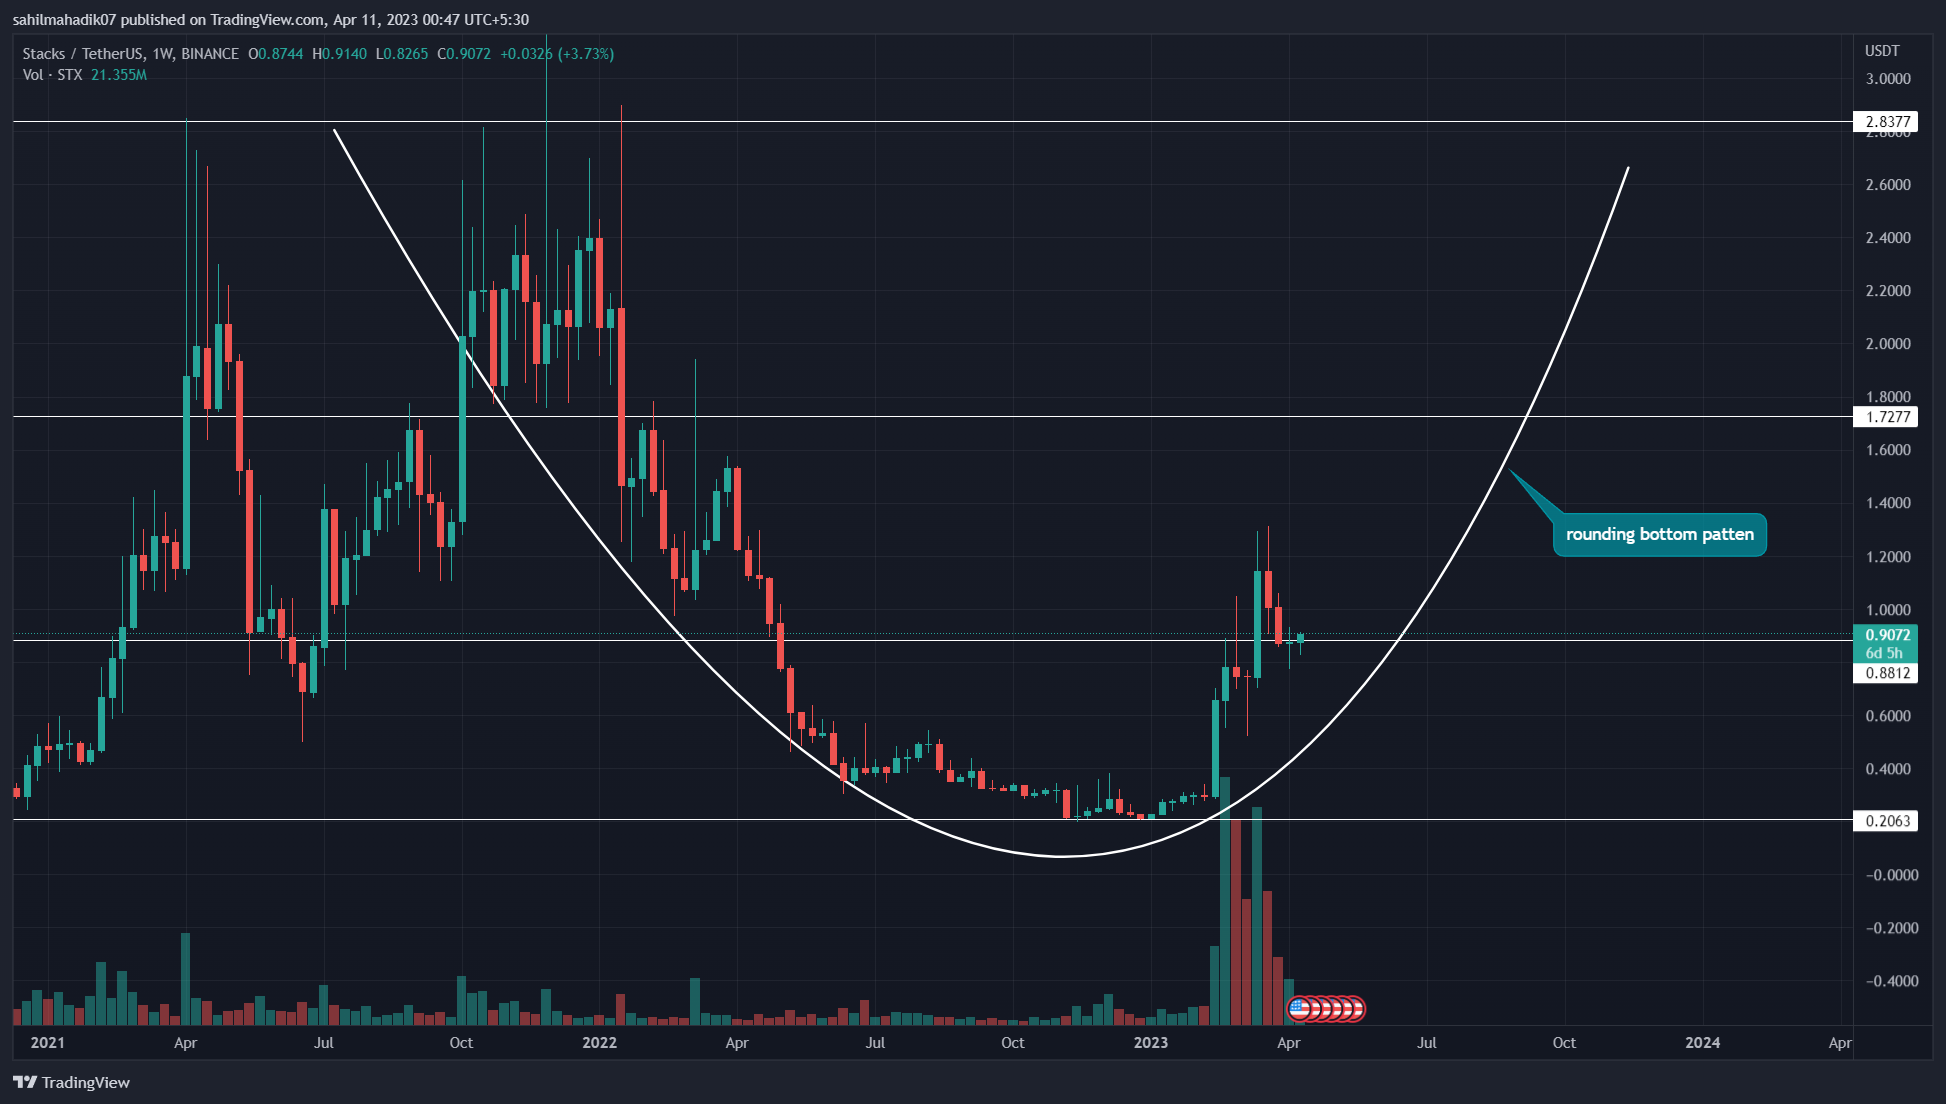
In the Weekly time frame chart, the Stacks coin price shows the formation of a rounding bottom pattern, It is characterized by a long-term downtrend in prices followed by a gradual sideways shift followed by a gradual increase in prices over time, forming a “U” shape.
The rounding bottom pattern is considered to be a bullish reversal pattern, indicating a potential trend reversal from a bearish to a bullish trend. This is because the gradual shift in prices indicates that demand for the asset is increasing, and the long-term downtrend is losing momentum.
Trending Stories
The STX price showcased the bottom of the chart pattern near the $0.206 mark from where the coin has recorded 322% growth within the last four months. However, under the influence of the rounding bottom pattern, the coin price may rise to neckline resistance located near the $2.8 mark.
Technical Indicators Turned Bullish

Source- Tradingview
During the bottom pattern formation, the volume action showed minimal rise indicating the uncertainty in the market. However, the volume level surged significantly with the recent price rise indicating the interest of market participants in long opportunities.
The bullish rally also reclaimed the 20-50-and-100-weekly EMA offering an early sign of trend reversal and excellent pullback supports to prolong the potential bullish trend. A bullish crossover between 20 and 50 EMA may encourage more buying orders in the market.
A massive surge in the weekly RSI slope reflects a sustained growth in STX price.
Also Read: What Is Regenerative Finance (Refi) And Who Is It For?
Health Retracement In Ongoing Bull Run.
Source- Tradingview
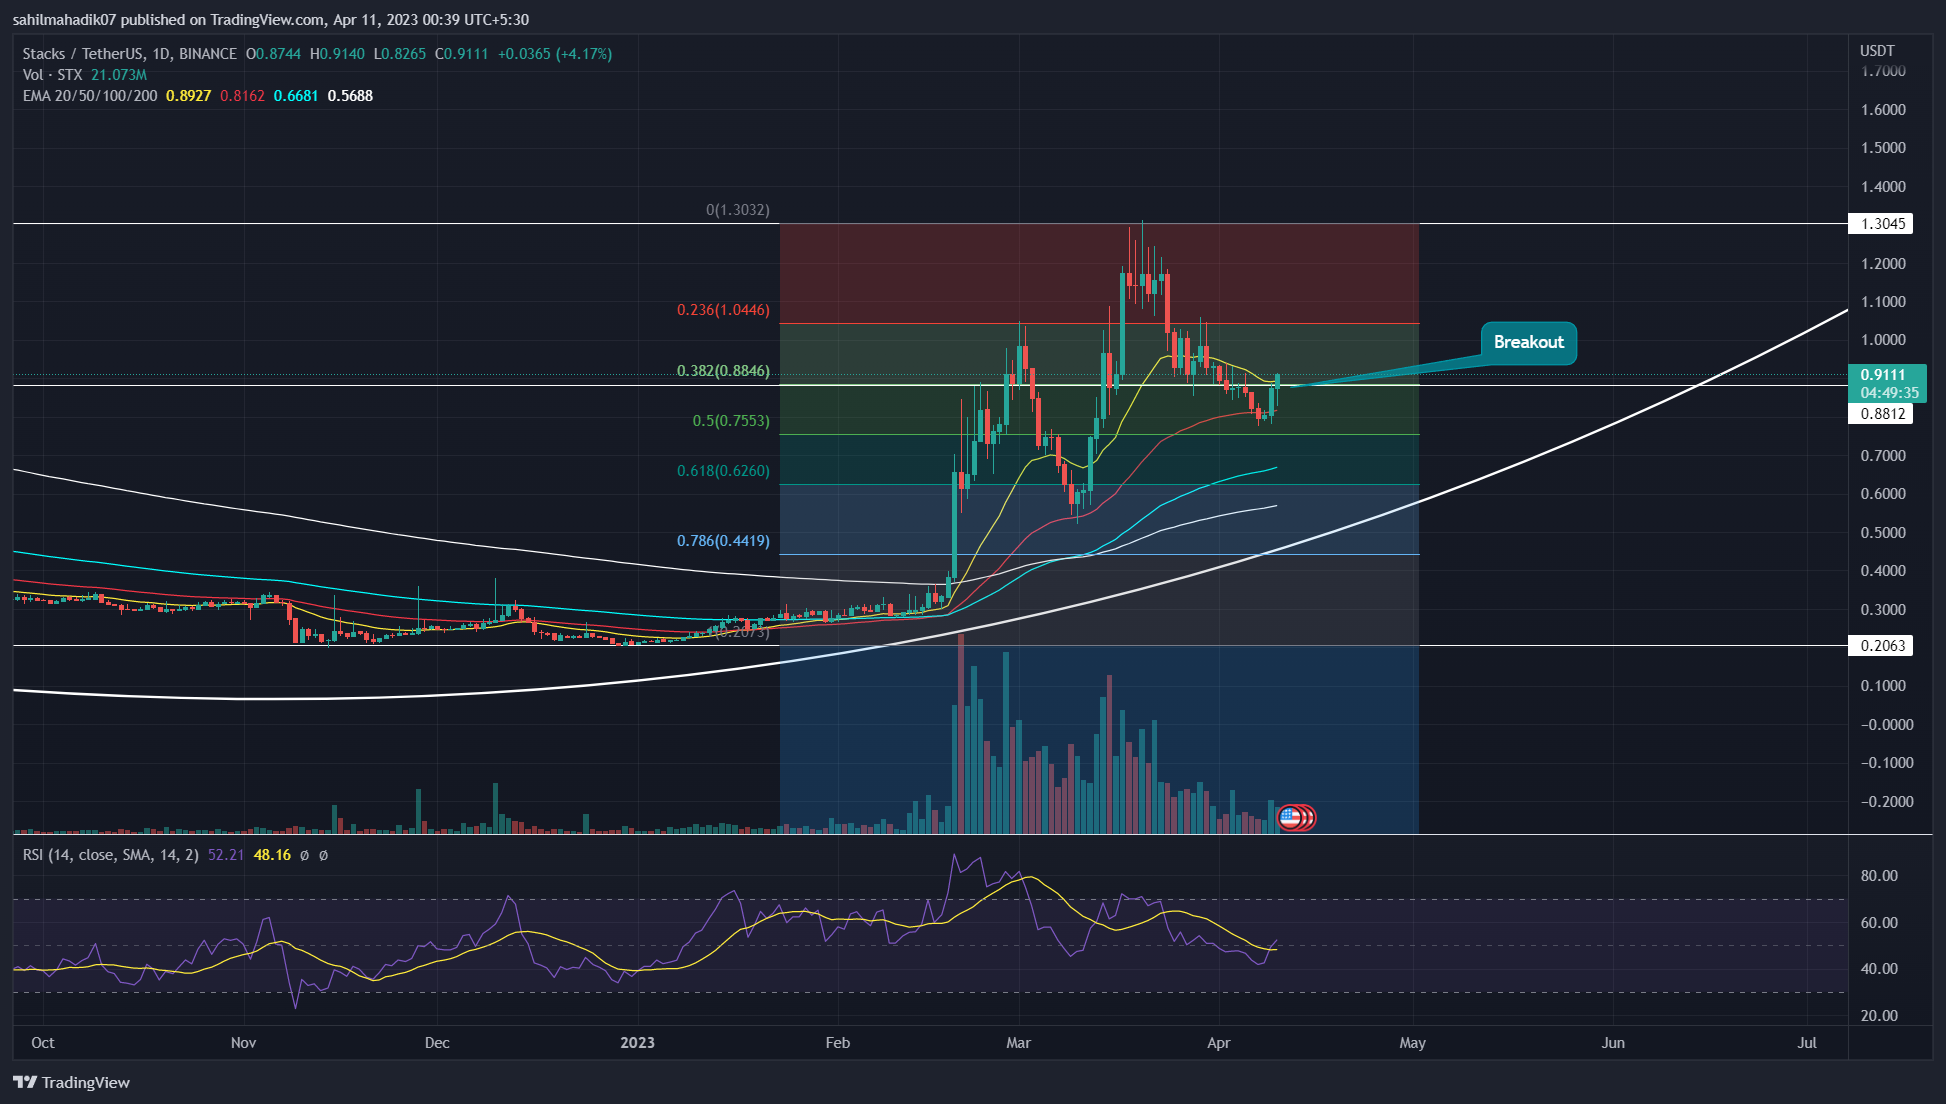
The ongoing recovery in stacks coin price formed a local top at $1.3 on 20th March and then turned down in response in increase uncertainty in the crypto market. The resulting correction phase has tumbled the 40% within the last three weeks and plunged to the $0.778 mark.
However, the coin price has rebounded from the aforementioned level which is above the 50% Fibonacci retracement level. It is considered a correction phase completion above 0.5 FIB is a healthy retracement for the asset to resume bullish recovery.
Furthermore, the rising prices have recently breached an immediate resistance of $0.88 offering additional confirmation for the bullish rally.
Stacks Coin Intraday level Price Levels.
- Spot price: $7.195
- Trend- Bullish
- Volatility- Medium
- Resistance Levels: $7.68 and $8.12
- Support Levels: $6.6 and $6.2
Share this article on:
advertisement
The presented content may include the personal opinion of the author and is subject to market condition. Do your market research before investing in cryptocurrencies. The author or the publication does not hold any responsibility for your personal financial loss.
- SEO Powered Content & PR Distribution. Get Amplified Today.
- Platoblockchain. Web3 Metaverse Intelligence. Knowledge Amplified. Access Here.
- Source: https://coingape.com/markets/3-reasons-why-stack-coin-price-may-explode-in-2023/
- :is
- 1
- 10
- 2023
- 7
- 8
- 9
- a
- above
- Action
- Ad
- Additional
- and
- article
- asset
- assist
- At
- author
- avatar
- banner
- BE
- bearish
- Beauty
- because
- before
- between
- blockchain
- Bottom
- Brian
- bull
- Bull Run
- Bullish
- buyers
- Buying
- by
- characterized
- Chart
- Coin
- Coingape
- COM
- completion
- condition
- confirmation
- considerable
- considered
- content
- correction phase
- could
- crypto
- Crypto Market
- cryptocurrencies
- cryptocurrency
- Demand
- different
- down
- Early
- EMA
- encourage
- Entertainment
- Ether (ETH)
- excellent
- Fashion
- finance
- financial
- follow
- followed
- For
- formation
- formed
- FRAME
- from
- grab
- gradual
- Growth
- Have
- healthy
- higher
- Hit
- hold
- HOURS
- However
- HTTPS
- i
- immediate
- in
- include
- Including
- Increase
- increasing
- indicates
- indicating
- Indicators
- influence
- interest
- investing
- IT
- journalism
- jpg
- Last
- Level
- levels
- local
- located
- Long
- long-term
- losing
- loss
- March
- mark
- Market
- market research
- massive
- May..
- minimal
- minor
- Momentum
- months
- more
- Near
- New
- of
- offering
- on
- ongoing
- Opinion
- opportunities
- Opportunity
- orders
- participants
- past
- Pattern
- personal
- phase
- plato
- Plato Data Intelligence
- PlatoData
- plugin
- potential
- presented
- price
- price rise
- Prices
- Prior
- Publication
- pullback
- rally
- Read
- reasons
- recent
- recently
- recorded
- recovery
- ReFi
- reflects
- regenerative
- Regenerative Finance
- research
- Resistance
- response
- responsibility
- resulting
- resume
- retracement
- Reversal
- Rise
- rising
- Run
- Shape
- Share
- shift
- should
- Shows
- sideways
- sign
- significantly
- Stacks
- STX
- subject
- Supports
- surge
- Surged
- Sustainability
- that
- The
- The Weekly
- three
- time
- to
- top
- Topics
- TradingView
- Trend
- trending
- triggered
- Turned
- Uncertainty
- under
- variety
- volume
- weekly
- Weeks
- which
- WHO
- with
- within
- working
- written
- years
- Your
- zephyrnet