
Published 21 mins ago
Ethereum Price Prediction: Under the influence of a support trendline, the Ethereum price has led an aggressive rally for nearly a month. The coin price rebounded from the dynamic trendline several indicate traders are accumulating at bullish pullbacks reflecting a key trait of an established recovery. Here’s how this pattern may influence the near future price of the Ethereum coin.
advertisement
Key Points:
- The post-correction recovery could surge the ETH price by 10%
- The midline of the Bollinger band indicator act as a dynamic support for rising Ethereum price
- The intraday trading volume in Ether is $12.5 Billion, indicating a 39% gain.
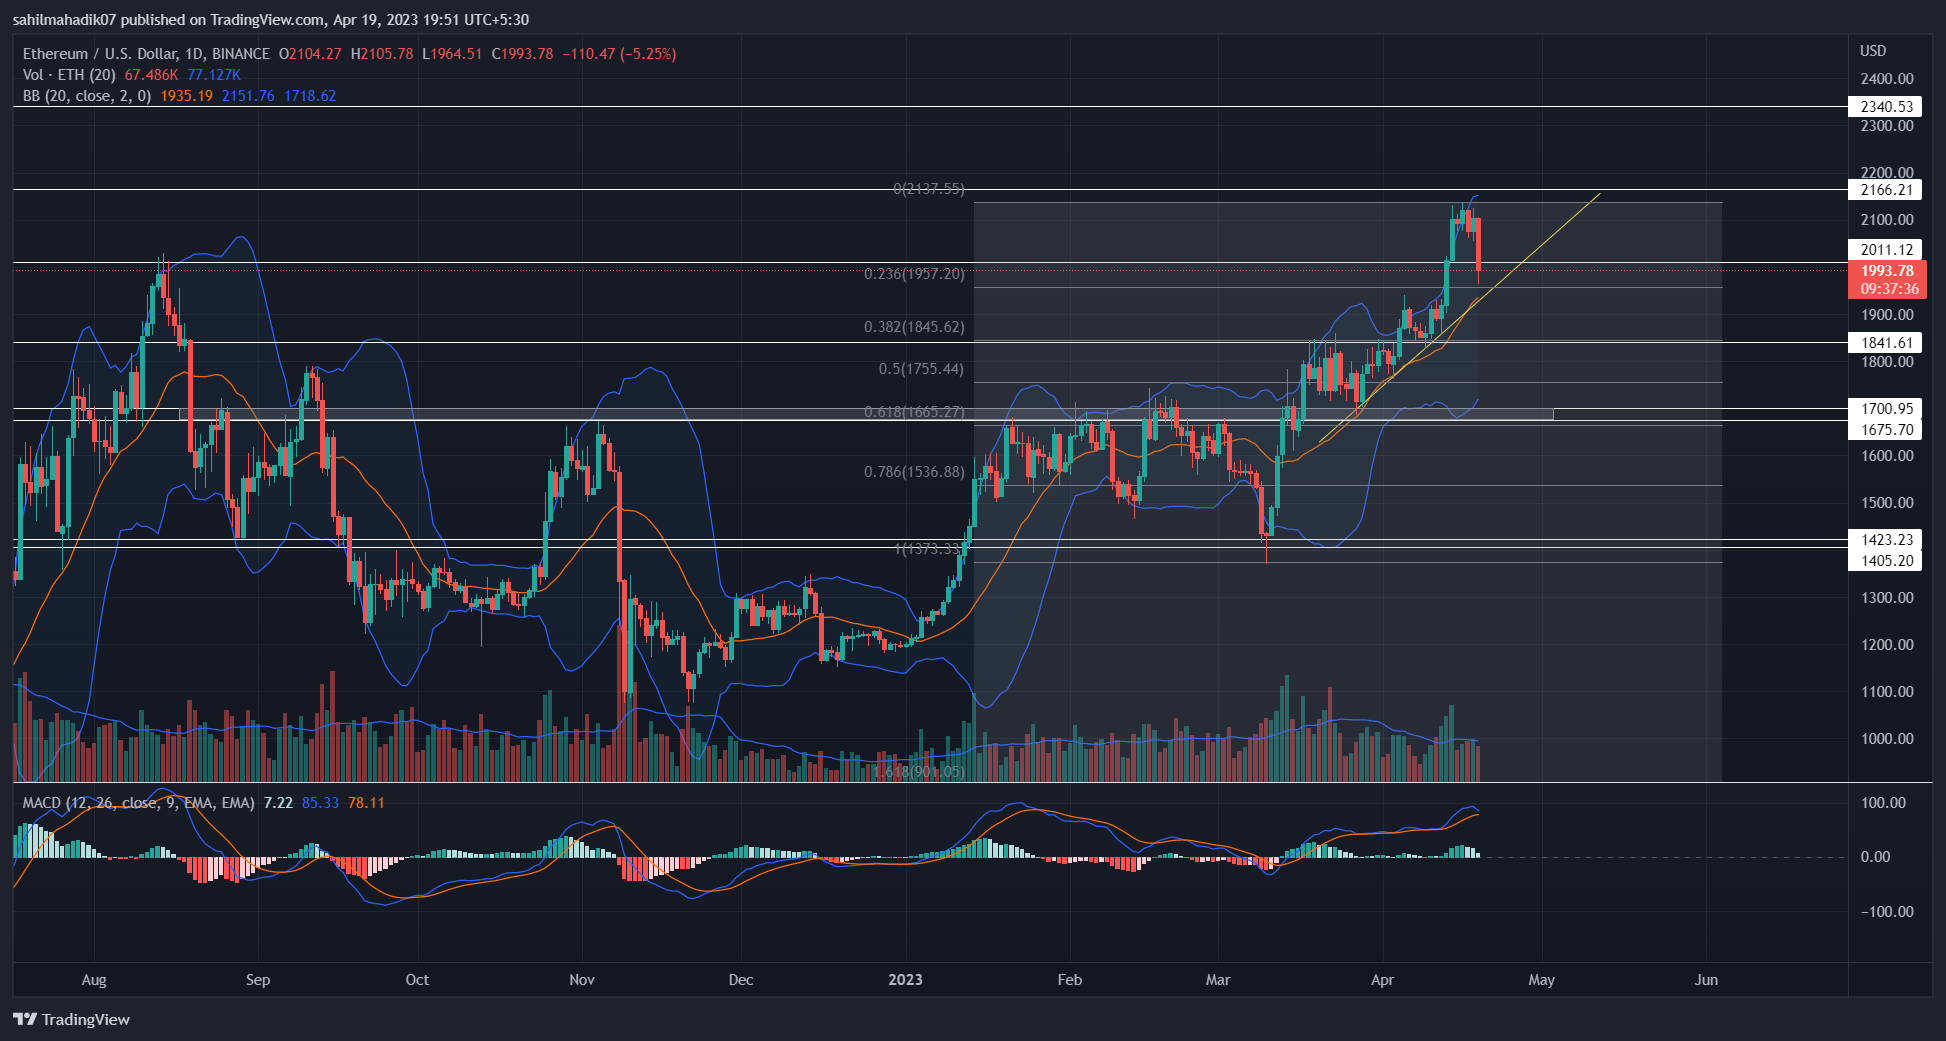
Source- Tradingview
The Ethereum price recovery recently peaked around the $2135 mark and reverted lower for an occasional pullback. Such correction usually benefits a long-term rally by absorbing the excess selling pressure and recuperating buyers.
However, today the crypto market witnessed a sudden sell-off and significant liquidations in several cryptocurrencies. As a result, the Ethereum price showed a 6% intraday loss and plugged into the current price of the $1981 mark.
Trending Stories
Also Read: Crypto Market Selloff: Here’s Why Bitcoin, Ethereum Price Are Falling Sharply
However, the falling may face strong demand pressure near $1950, due to aligned support of the ascending support trendline and 0.236 Fibonacci retracement level. This high area of interest(AOI) could offer significant footing to buyers and encourage the resumption of bullish recovery.
If the buyers managed to sustain above the trendline, the coin price may rise 10% to hit the $2166 ceiling.
While overall sentiment for Ethereum is still bullish a breakdown below the support trendline could trigger a considerable correction.
Technical Indicator
MACD: A potential bearish crossover between the MACD(blue) and the signal(orange) line will project a sell alert and accelerate the selling pressure in the market.
Bollinger Band: A coin price resonating between the upper and midline of the Bollinger band indicator indicates the buyer still has an upper hand.
Ethereum Coin Price Intraday Levels-
- Spot rate: $1991
- Trend: Bearish
- Volatility: Low
- Resistance level- $2000 and $2166
- Support level- $1833 and $1700
Share this article on:
advertisement
The presented content may include the personal opinion of the author and is subject to market condition. Do your market research before investing in cryptocurrencies. The author or the publication does not hold any responsibility for your personal financial loss.
- SEO Powered Content & PR Distribution. Get Amplified Today.
- Platoblockchain. Web3 Metaverse Intelligence. Knowledge Amplified. Access Here.
- Minting the Future w Adryenn Ashley. Access Here.
- Source: https://coingape.com/markets/eth-price-prediction-ethereum-price-plunged-6-today-is-more-correction-underway/
- :has
- :is
- 1
- 10
- 7
- 8
- 9
- a
- above
- accelerate
- Act
- Ad
- After
- aggressive
- Alert
- aligned
- and
- any
- ARE
- AREA
- around
- article
- AS
- At
- author
- avatar
- BAND
- banner
- bearish
- Beauty
- before
- below
- benefits
- between
- Billion
- Bitcoin
- blockchain
- Blue
- Breakdown
- Brian
- Bullish
- buyers
- by
- ceiling
- Coin
- Coingape
- COM
- condition
- considerable
- content
- could
- crypto
- Crypto Market
- cryptocurrencies
- cryptocurrency
- Current
- Demand
- details
- different
- dynamic
- encourage
- Entertainment
- established
- ETH
- eth price
- eth price prediction
- Ether
- Ether (ETH)
- ethereum
- ethereum (ETH)
- Ethereum Price
- Face
- Falling
- Fashion
- finance
- financial
- follow
- For
- from
- future
- Future Price
- Gain
- hand
- Have
- High
- Hit
- hold
- How
- HTTPS
- i
- in
- include
- Including
- indicate
- indicates
- indicating
- Indicator
- influence
- investing
- journalism
- jpg
- Key
- Last
- Led
- Line
- liquidations
- long-term
- loss
- managed
- mark
- Market
- market research
- May..
- Month
- more
- Near
- nearly
- occasional
- of
- offer
- on
- Opinion
- Orange
- overall
- past
- Pattern
- personal
- plato
- Plato Data Intelligence
- PlatoData
- Plugged
- plugin
- points
- potential
- prediction
- presented
- pressure
- price
- Price Prediction
- project
- Project A
- Publication
- pullback
- rally
- Rate
- Read
- recently
- recovery
- research
- responsibility
- result
- retracement
- Rise
- rising
- sell
- sell-off
- Selling
- SellOff
- sentiment
- several
- shanghai
- Share
- significant
- Still
- strong
- subject
- such
- sudden
- support
- surge
- The
- to
- today
- Topics
- Traders
- Trading
- trading volume
- TradingView
- trending
- trigger
- under
- Underway
- upgrade
- usually
- variety
- volume
- will
- witnessed
- working
- written
- years
- Your
- zephyrnet