Ripple’s token price is rising above $0.50 against the US Dollar. XRP price could start a fresh rally if it clears the $0.515 and $0.525 resistance levels.
- Ripple’s token price is attempting a move above $0.515 and $0.525 against the US dollar.
- The price is now trading above $0.500 and the 100 simple moving average (4 hours).
- There is a connecting bullish trend line forming with support near $0.500 on the 4-hour chart of the XRP/USD pair (data source from Kraken).
- The pair might gain bullish momentum if there is a close above $0.515.
Ripple’s Token Price Could Accelerate Above $0.515
In the last XRP price prediction, we discussed a possible upward move in Ripple’s XRP against the US Dollar. The price did follow a positive path above the $0.480 pivot level, like Bitcoin and Ethereum.
There was a clear move above the $0.50 resistance zone. It climbed above the 50% Fib retracement level of the key decline from the $0.5491 swing high to the $0.4590 low. The bulls are now attempting more gains above the $0.515 resistance.
XRP is now trading above $0.500 and the 100 simple moving average (4 hours). Besides, there is a connecting bullish trend line forming with support near $0.500 on the 4-hour chart of the XRP/USD pair.
On the upside, immediate resistance is near the $0.515 level. It is close to the 61.8% Fib retracement level of the key decline from the $0.5491 swing high to the $0.4590 low. The next major resistance is near the $0.5250 level. A close above the $0.525 level could send the price toward the $0.550 barrier.
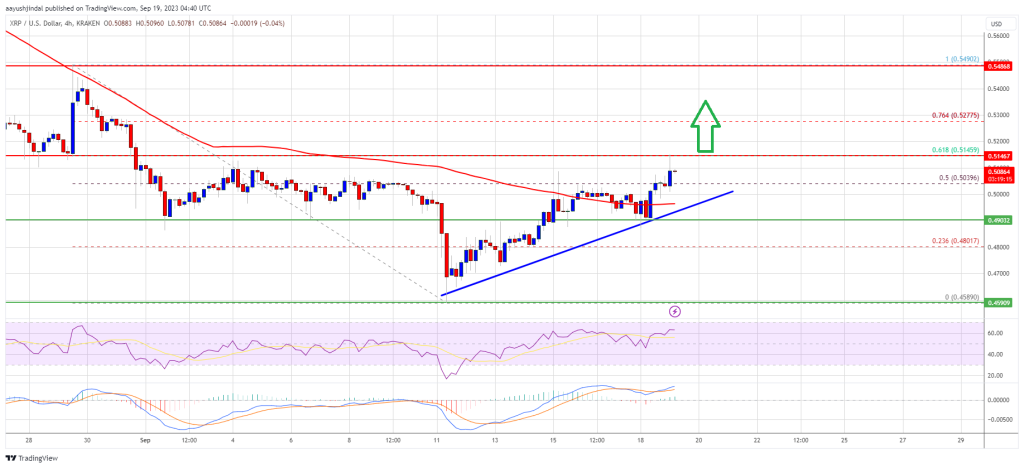
Source: XRPUSD on TradingView.com
A successful break above the $0.550 resistance level might start a strong rally toward the $0.585 resistance. Any more gains might call for a test of the $0.600 resistance.
Are Dips Limited in XRP?
If ripple fails to clear the $0.515 resistance zone, it could start a downside correction. Initial support on the downside is near the $0.50 zone and the trend line.
The next major support is at $0.490. If there is a downside break and a close below the $0.490 level, XRP’s price could extend losses. In the stated case, the price could retest the $0.458 support zone.
Technical Indicators
4-Hours MACD – The MACD for XRP/USD is now gaining pace in the bullish zone.
4-Hours RSI (Relative Strength Index) – The RSI for XRP/USD is now above the 50 level.
Major Support Levels – $0.500, $0.490, and $0.458.
Major Resistance Levels – $0.515, $0.525, and $0.550.
- SEO Powered Content & PR Distribution. Get Amplified Today.
- PlatoData.Network Vertical Generative Ai. Empower Yourself. Access Here.
- PlatoAiStream. Web3 Intelligence. Knowledge Amplified. Access Here.
- PlatoESG. Carbon, CleanTech, Energy, Environment, Solar, Waste Management. Access Here.
- PlatoHealth. Biotech and Clinical Trials Intelligence. Access Here.
- BlockOffsets. Modernizing Environmental Offset Ownership. Access Here.
- Source: https://www.bitcoinnewsminer.com/xrp-price-prediction-will-it-break-through-this-key-resistance-and-rally/
- :is
- 1
- 100
- 50
- 500
- a
- above
- accelerate
- against
- and
- any
- ARE
- At
- attempting
- average
- barrier
- below
- besides
- Bitcoin
- Break
- Bullish
- Bulls
- call
- case
- Chart
- clear
- Climbed
- Close
- Connecting
- could
- data
- Decline
- DID
- discussed
- Dollar
- downside
- Ether (ETH)
- extend
- fails
- follow
- For
- fresh
- from
- Gain
- gaining
- Gains
- High
- HOURS
- HTTPS
- if
- immediate
- in
- index
- initial
- IT
- Key
- key resistance
- Kraken
- Last
- Level
- levels
- like
- Limited
- Line
- losses
- Low
- MACD
- major
- max-width
- might
- Momentum
- more
- move
- moving
- moving average
- Near
- NewsBTC
- next
- now
- of
- on
- Pace
- pair
- path
- Pivot
- plato
- Plato Data Intelligence
- PlatoData
- positive
- possible
- prediction
- price
- Price Prediction
- rally
- relative
- relative strength index
- Resistance
- retracement
- Ripple
- rising
- rsi
- send
- Simple
- Source
- start
- stated
- strength
- strong
- successful
- support
- support levels
- Swing
- test
- The
- There.
- this
- Through
- to
- token
- toward
- Trading
- TradingView
- Trend
- Upside
- upward
- us
- US Dollar
- was
- we
- will
- with
- xrp
- XRP Price
- XRP price prediction
- XRP/USD
- zephyrnet