Published 21 hours ago
XRP Price Prediction: A bearish breakdown from the ascending triangle pattern of the 4-hour time frame chart indicates the XRP price is poised for a prolonged correction. Considering this altcoin’s growth in the second half of March, the ongoing retracement is temporary and can provide a favorable pullback opportunity to interested traders. Here are some important levels that can replenish the prevailing bullish recovery.
advertisement
Key Points:
- A bearish breakdown from the support trendline of the triangle pattern threatens the XRP price by 5%
- The overall bullish sentiment for the XRP price will remain intact until the price sustains above 0.5 FIB at the $0.44 mark.
- The intraday trading volume in the XRP is $1.2 Billion, indicating a 0.5% loss.
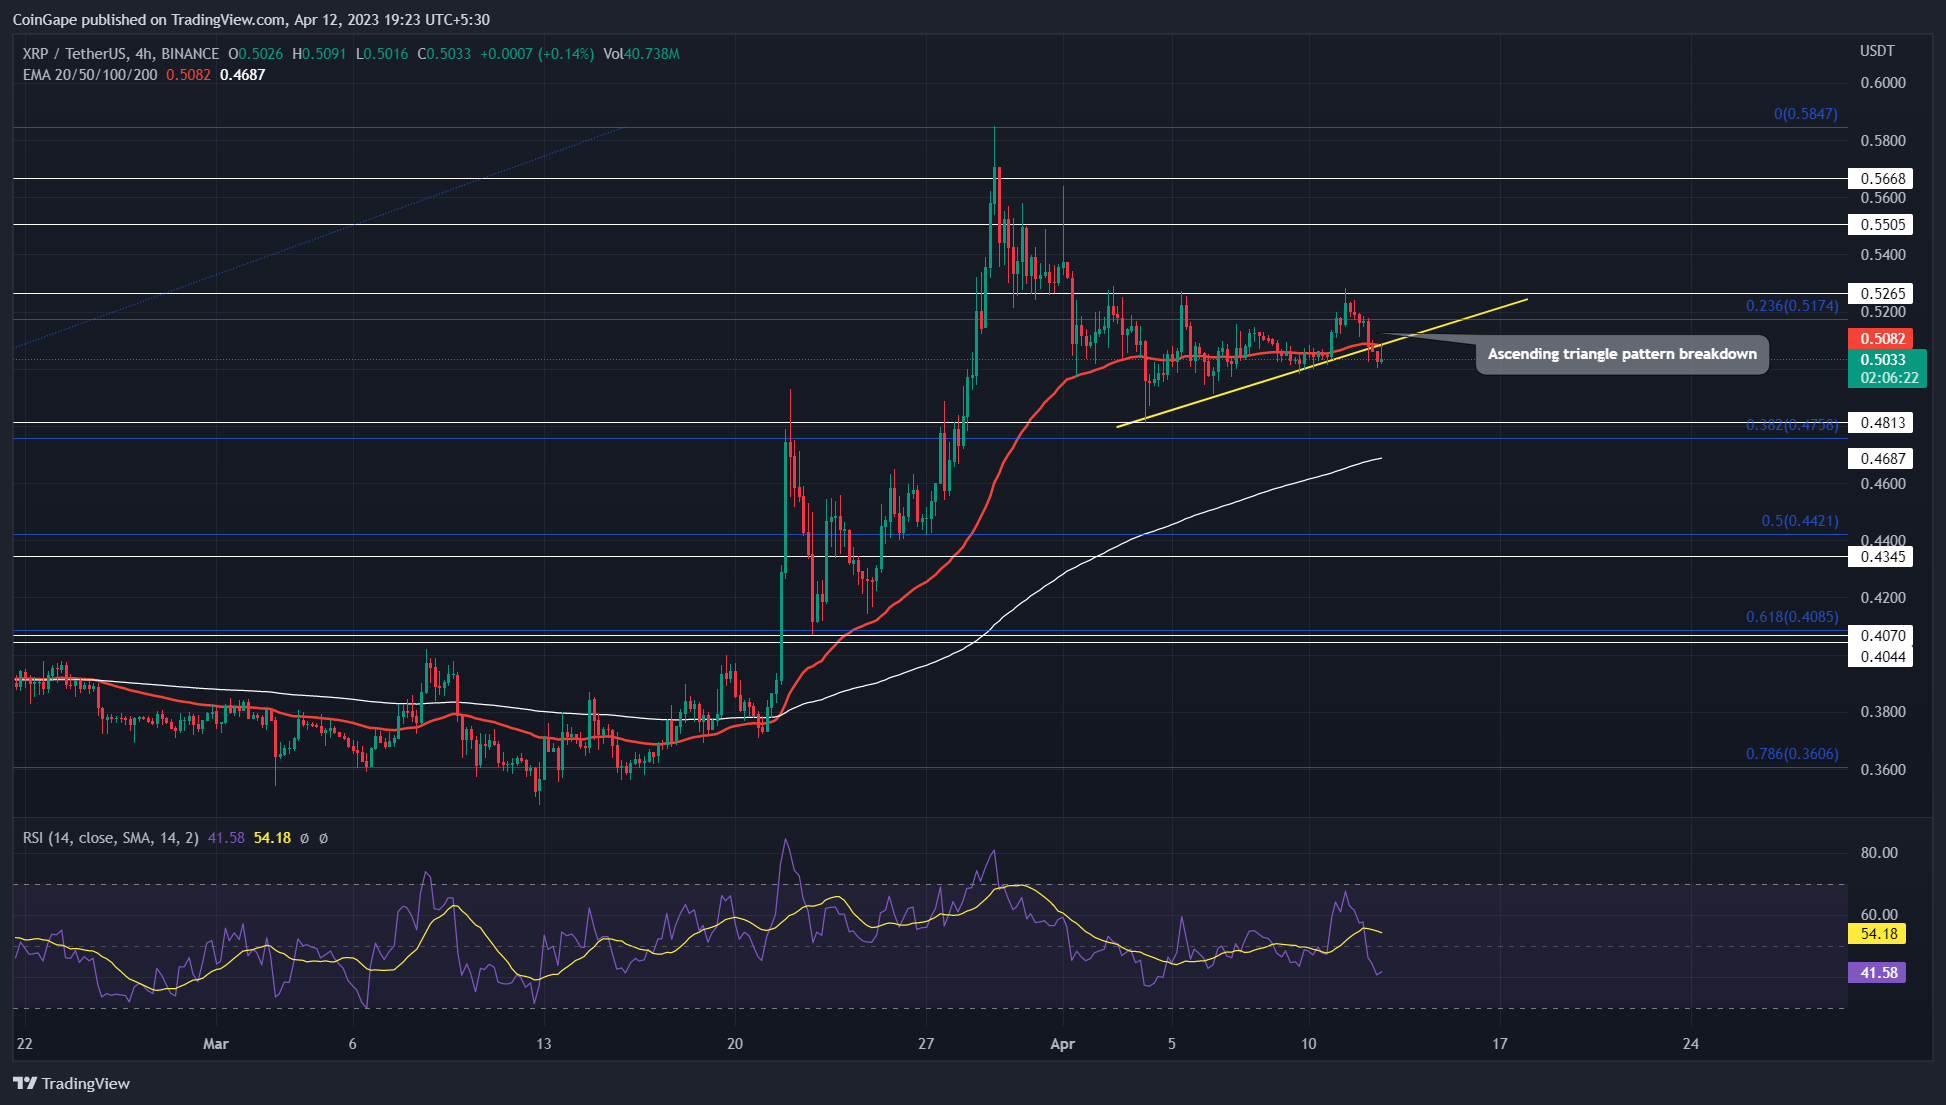
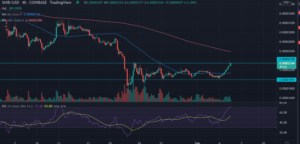
Source- Tradingview
Amid the increasing uncertainty in the crypto market, the ongoing correction phase in XRP price took a slight detour and turned sideways. The coin price resonated in a short range for the past two weeks and revealed the formation of an ascending triangle pattern.
Typically this chart pattern is a bullish setup and offers significant growth once the prices breached the neckline resistance. However, the sellers took the advantage of increasing FUD and breached the pattern’s support trendline.
Trending Stories
Also Read: Top 6 Liquid Staking Platforms On Ethereum
By the press time, the XRP price trades at $0.504 with an intraday loss of 2.36%. The 4-hour chart shows a higher price rejection candle at the breach trendline, indicating the seller is using the reclaimed level to pressure buyers.
With sustained selling, the XRP price may tumble 6% and reach the combined support of $0.48 and 0.382 Fibonacci retracement levels.
Technical Indicator
RSI: the RSI slope breakdown below the midline indicates the market sentiment in leaning toward crypto sellers.
EMAs: The falling XRP price breached the 20 and 50 EMA of the 4-hour time frame chart giving an additional edge to short-seller
XRP Intraday Price Levels
- Spot price: $0.50
- Trend: Bearish
- Volatility: High
- Resistance level- $0.52 and $0.56
- Support level- $0.48 and $0.44
Share this article on:
advertisement
The presented content may include the personal opinion of the author and is subject to market condition. Do your market research before investing in cryptocurrencies. The author or the publication does not hold any responsibility for your personal financial loss.
<!– Close Story–>
- SEO Powered Content & PR Distribution. Get Amplified Today.
- Platoblockchain. Web3 Metaverse Intelligence. Knowledge Amplified. Access Here.
- Source: https://coingape.com/markets/xrp-price-prediction-this-bearish-pattern-puts-xrp-price-for-6-12-downside-risk/
- :is
- 1
- 10
- 7
- 8
- 9
- a
- above
- Ad
- Additional
- ADvantage
- and
- ARE
- article
- At
- author
- avatar
- banner
- bearish
- Beauty
- before
- below
- Billion
- blockchain
- breach
- Breakdown
- Brian
- Bullish
- buyers
- by
- CAN
- Chart
- Coin
- Coingape
- COM
- combined
- condition
- considering
- content
- correction phase
- crypto
- Crypto Market
- Crypto News
- cryptocurrencies
- cryptocurrency
- different
- downside
- Edge
- Entertainment
- Ether (ETH)
- Falling
- Fashion
- Fibonacci
- Fibonacci retracement levels
- finance
- financial
- follow
- For
- formation
- FRAME
- from
- FUD
- Giving
- Growth
- Half
- Have
- here
- higher
- hold
- HOURS
- However
- HTTPS
- i
- important
- in
- include
- Including
- increasing
- indicates
- indicating
- interested
- investing
- journalism
- jpg
- Last
- Level
- levels
- Liquid
- liquid staking
- loss
- March
- mark
- Market
- market research
- market sentiment
- May..
- news
- of
- Offers
- on
- ongoing
- Opinion
- Opportunity
- overall
- past
- Pattern
- personal
- phase
- Platforms
- plato
- Plato Data Intelligence
- PlatoData
- plugin
- points
- prediction
- presented
- press
- pressure
- price
- Price Prediction
- Prices
- provide
- Publication
- pullback
- Puts
- range
- reach
- Read
- recovery
- remain
- research
- Resistance
- responsibility
- retracement
- Revealed
- Ripple
- Risk
- Second
- Sellers
- Selling
- sentiment
- setup
- Share
- Short
- Shows
- sideways
- significant
- some
- Staking
- subject
- support
- temporary
- that
- The
- threatens
- time
- to
- Topics
- toward
- Traders
- trades
- Trading
- trading volume
- TradingView
- trending
- Turned
- Uncertainty
- variety
- volume
- Weeks
- will
- with
- working
- written
- xrp
- XRP Price
- XRP price prediction
- years
- Your
- zephyrnet