Published 10 hours ago
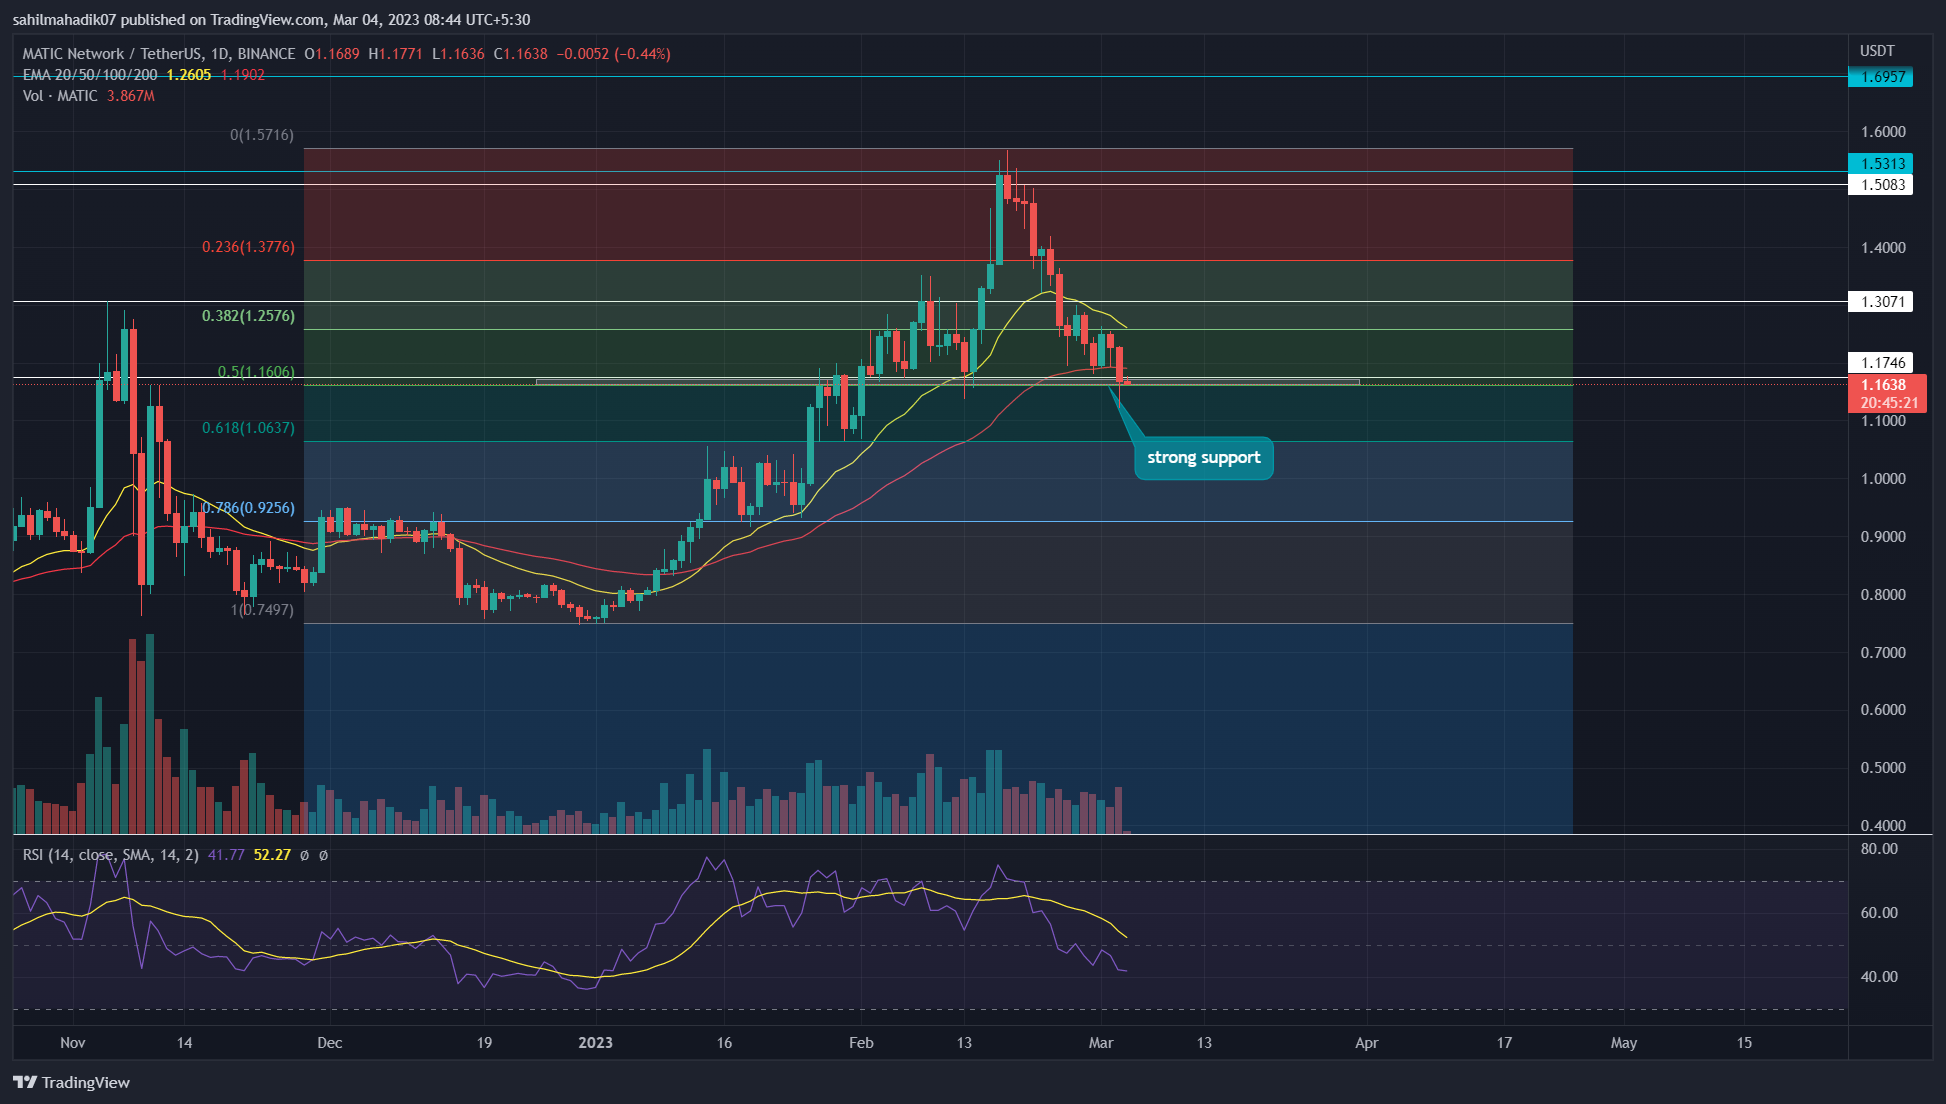
In the daily time frame chart, the MATIC coin price shows a V-top reversal from the $1.53 resistance. This type of bearish reversal signals a directional downfall and strong commitment from the sellers. So far, the MATIC price has lost 24.5% over a fortnight and plunged to $1.175. Here’s how this support may influence this altcoin’s near future.
advertisement
Key Points
- The 0.5FIB level at $1.175 creates a strong support
- A potential breakdown from the $1.175 support may plunge the MATIC price 8.5% down to hit the $1.06 mark.
- The intraday trading volume in the MATIC is $401 Million, indicating a 20% loss.
Source- -Tradingview
Amid the ongoing correction phase in the crypto market, the MATIC price breached the $1.3 support which was previously the last swing high resistance. Thus, this breakdown accelerated the current selling pressure in the market and plummeted the coin price to a combined support of $0.5 Fibonacci retracement and $1.175.
On March 3rd, when the crypto market faced a sharp sell-off, the MATIC sellers tried to breach $1.175. However, this attempt failed and left a long-lower price rejection candle at the aforementioned support.
Trending Stories
This long tail attached to the daily candle indicated that the buyers are actively defending this level. Thus, the polygon coin is likely to bounce back from this support and revisit the $1.3 as a potential resistance again.
Also Read: Top Eco-Friendly Crypto Projects To Invest In 2023
This $1.3 level is crucial for coin holders to determine the future price of MATIC coin,
Thus, if the prices turned down from the $1.3 resistance, it would indicate the market sentiment has flipped from buying on dips to selling on rallies. If this happens, the sellers may soon give another breakdown attempt from the $1.17.
A breakout above $1.3 will hint at the replenished bullish momentum and try to resume the bullish rally.
Technical Indicators
RSI: The daily RSI slope dived deeper into the bearish territory indicating the growth in underlying selling momentum.
advertisement
EMAs: amid the recent downfall, the MATIC price lost the 20-day EMA slope, which now flipped to potential resistance and can assist the seller to prolong the correction fall.
MATIC Coin Price Intraday Levels
- Spot rate: $1.16
- Trend: Bearish
- Volatility: Low
- Resistance levels- $1.3, and $1.37.
- Support levels- $1.18 and $1.07
Share this article on:
advertisement
The presented content may include the personal opinion of the author and is subject to market condition. Do your market research before investing in cryptocurrencies. The author or the publication does not hold any responsibility for your personal financial loss.
<!– Close Story–>
- SEO Powered Content & PR Distribution. Get Amplified Today.
- Platoblockchain. Web3 Metaverse Intelligence. Knowledge Amplified. Access Here.
- Source: https://coingape.com/markets/sellers-in-control-may-pull-matic-price-below-1-5-mark-keep-holding/
- 1
- 10
- 7
- 9
- a
- above
- accelerated
- actively
- Ad
- Amid
- and
- Another
- article
- assist
- author
- avatar
- back
- banner
- bearish
- Beauty
- before
- below
- blockchain
- Bounce
- breach
- Breakdown
- breakout
- Brian
- Bullish
- buyers
- Buying
- Chart
- Coin
- Coingape
- COM
- combined
- commitment
- condition
- content
- control
- correction phase
- creates
- crucial
- crypto
- Crypto Market
- crypto projects
- cryptocurrencies
- cryptocurrency
- Current
- daily
- deeper
- Defending
- Determine
- different
- down
- downfall
- Entertainment
- Ether (ETH)
- faced
- Failed
- Fall
- Fashion
- finance
- financial
- follow
- FRAME
- from
- future
- Future Price
- Give
- Growth
- happens
- High
- Hit
- hold
- holders
- holding
- HOURS
- How
- However
- HTTPS
- in
- include
- Including
- indicate
- indicated
- indicating
- influence
- Invest
- investing
- IT
- journalism
- Keep
- Last
- Level
- likely
- Long
- loss
- March
- mark
- Market
- market research
- market sentiment
- Matic
- MATIC price
- million
- Momentum
- Near
- ongoing
- Opinion
- past
- personal
- phase
- plato
- Plato Data Intelligence
- PlatoData
- plugin
- plunge
- Polygon
- Polygon (MATIC)
- Polygon (MATIC) Price
- potential
- presented
- pressure
- previously
- price
- Prices
- projects
- Publication
- rallies
- rally
- Rate
- Read
- recent
- research
- Resistance
- responsibility
- resume
- Reversal
- sell-off
- Sellers
- Selling
- sentiment
- Share
- sharp
- Shows
- signals
- Slope
- So
- so Far
- Soon
- strong
- subject
- support
- The
- The Future
- time
- to
- Topics
- Trading
- trading volume
- TradingView
- trending
- Turned
- underlying
- variety
- volume
- webp
- which
- will
- working
- would
- written
- years
- Your
- zephyrnet