Executive Summary
- In response to the approval of a suite of Bitcoin ETFs, Ether and Altcoins have rallied strongly last week. ETH managed to outperform BTC for the first time since October 2022.
- ETH also has seen increased activity in derivatives market, signalling a possible shift in capital flows. Bitcoin remains dominant in open interest and trade volumes, however ETH has regained some ground since the ETF approvals.
- We also assess the relative performance of Solana, scaling tokens, and various sector indexes relative to BTC and ETH as a gauge for risk appetite in a post-ETF world.
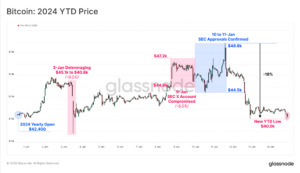
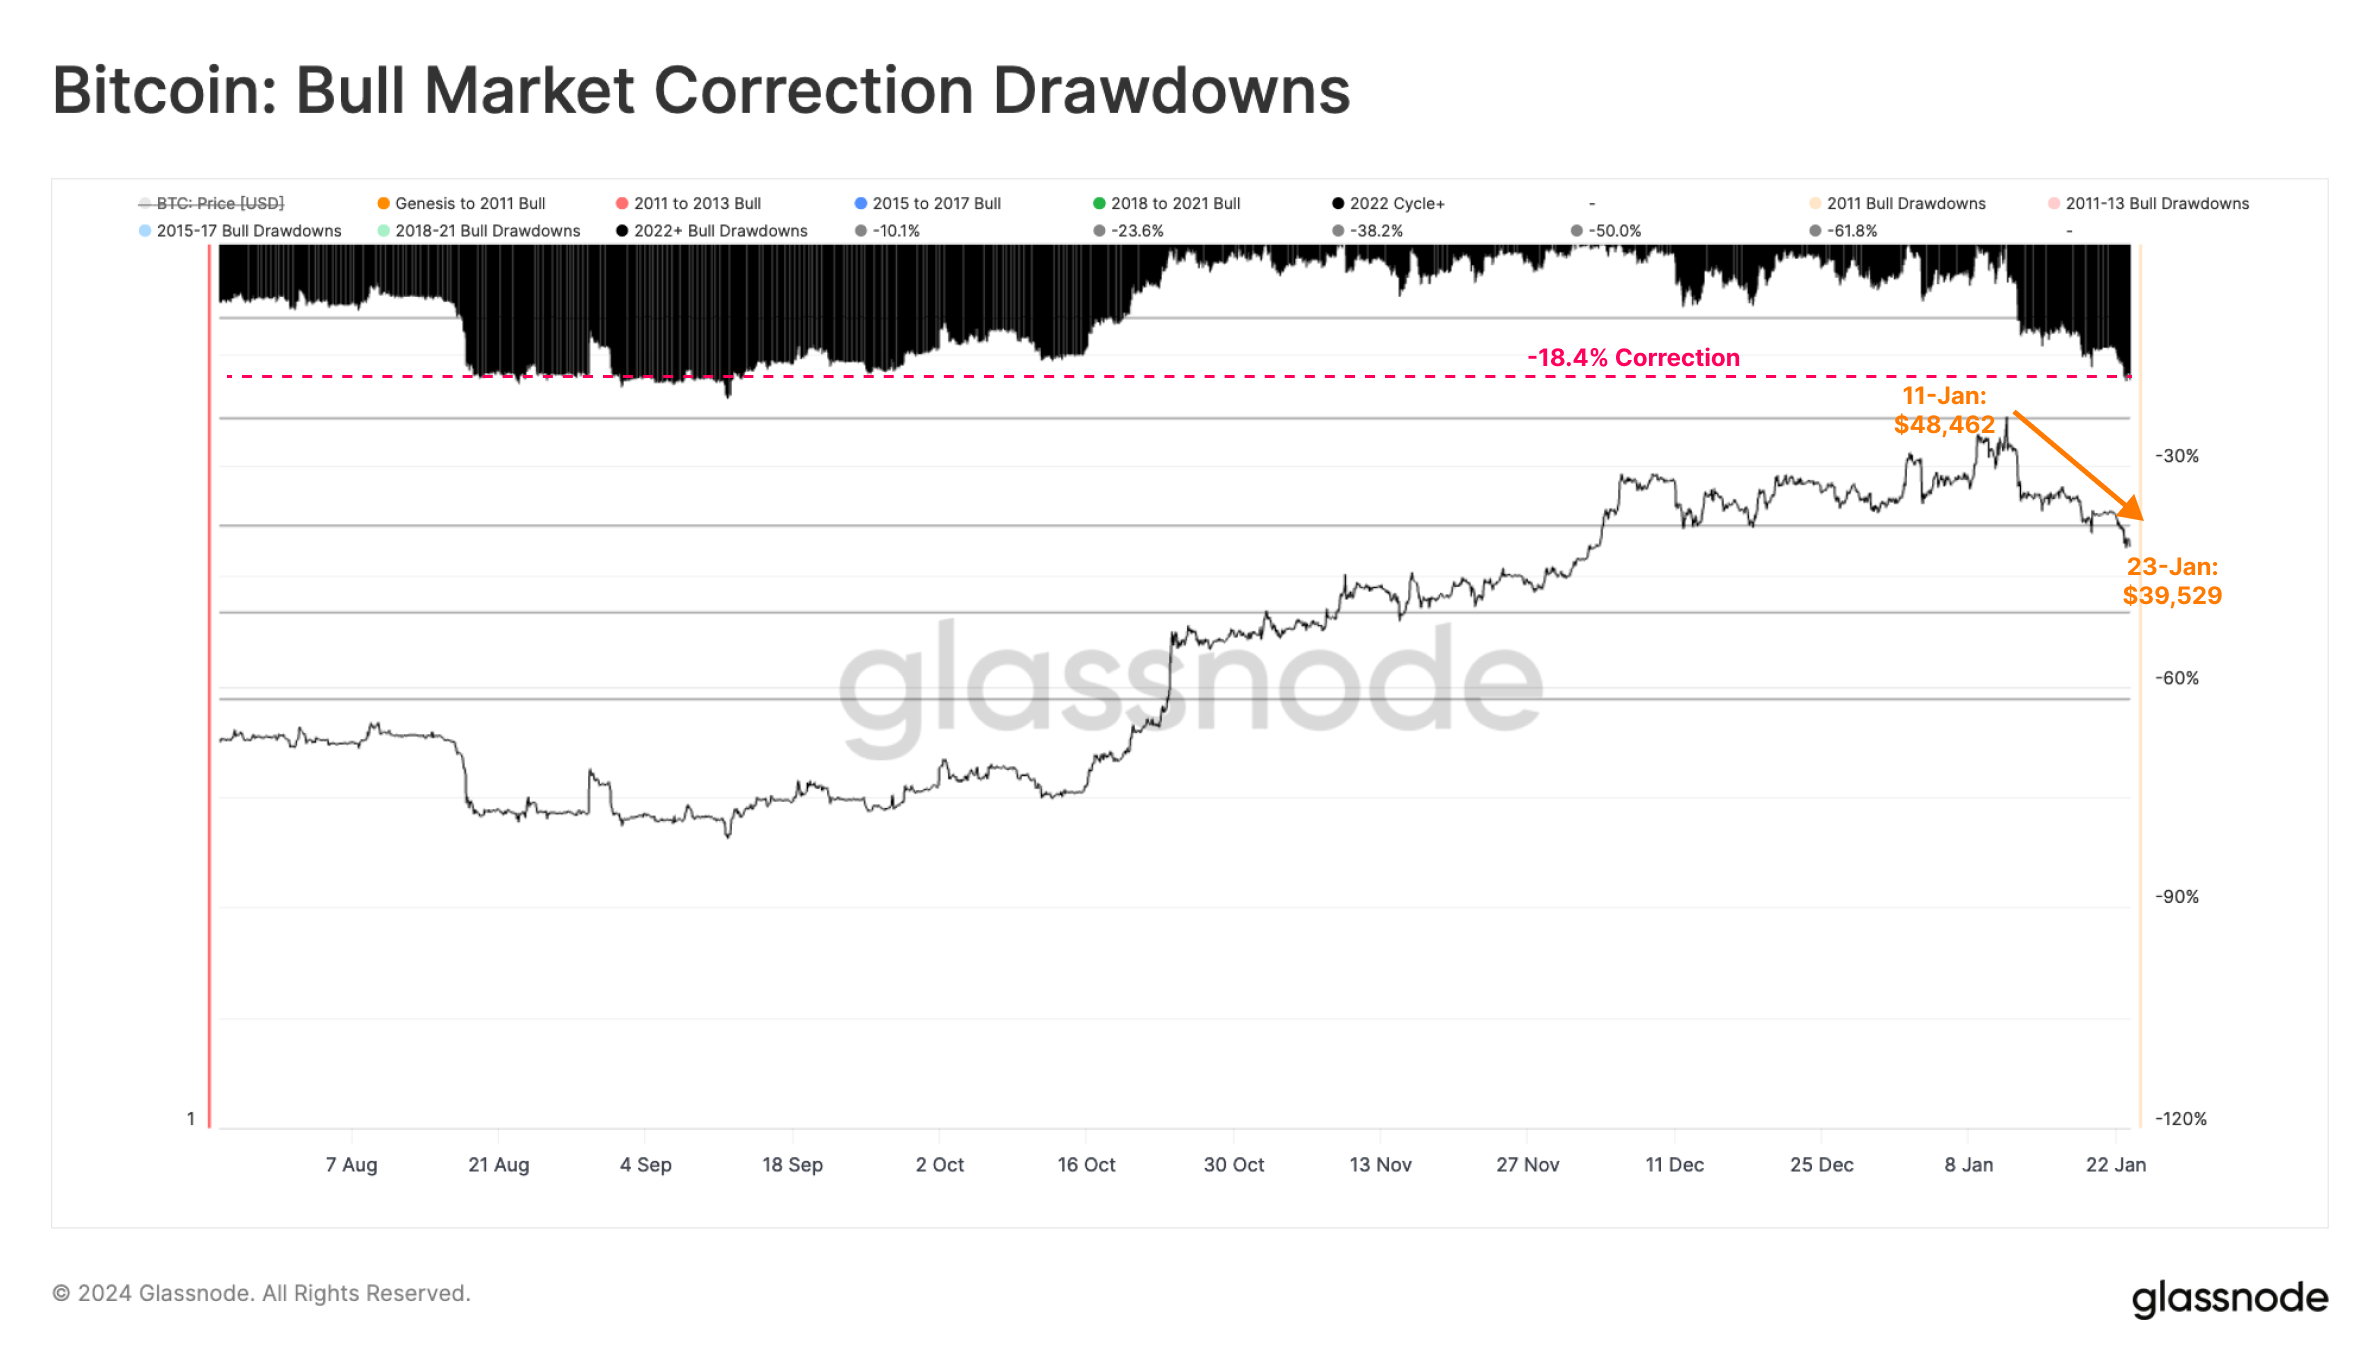
The digital asset markets experienced an uptick in speculation leading up to the Bitcoin ETF approvals, with a general sell-the-news event playing out over the following days. As we discussed in our last edition (WoC-03), the market had arguably priced the event to near perfection. Bitcoin prices have since fallen by -18%, dropping as low as $39.5k as of the time of writing.
Despite this correction, investors continue to look ahead, asking the question: Who’s next? Will there be new round of speculation regarding a potential ETH ETF approval? Will Solana continue to outperform ETH and BTC? Or is there now an appetite for risk and smaller market cap tokens?
Post ETF Speculation
Digital asset markets have experienced very strong performance since mid-October as ETF speculation and capital rotation narratives dominated.
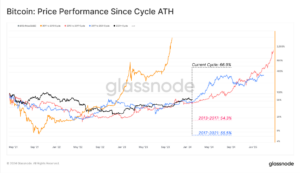
Bitcoin's market cap has increased by +68.8% since BlackRock first filed for their ETF, and the aggregate Altcoin Market Cap followed suit, rising by +68.9%. However, Ethereum has seen more sluggish relative momentum, underperforming the wider altcoin space by -17%.

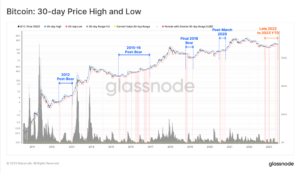
Zooming out, we can see that Bitcoin has generally been increasingly dominant over the past few years. Since the FTX Collapse in November 2022, BTC has increased its market cap dominance from 38.9% to 49.8%.
On the other hand, ETH has maintained its market cap dominance, ranging from 18.9% to 18.2%. It is mainly Altcoins that have lost market share in the crypto markets with their market cap dominance dropping from 28.3% to 24.2%, while Stablecoins have also decreased their share from 13.9% to 7.8%.

Shortly after the approval of the Bitcoin ETF, several issuers have filed or suggested a willingness to advocate for a spot ETF for Ethereum. Although obtaining approval for an ETH-based ETF might be more challenging due to the SEC possibly considering Ether as more of an investment contract, the markets appeared to express optimism.
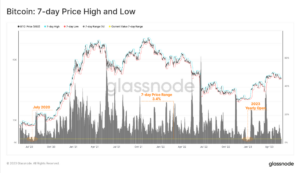
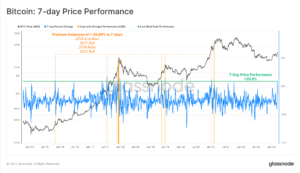
ETHs prices have surged by over +20% relative to BTC in recent weeks, making for the strongest performance since late 2022 on a quarterly, monthly, and weekly basis.

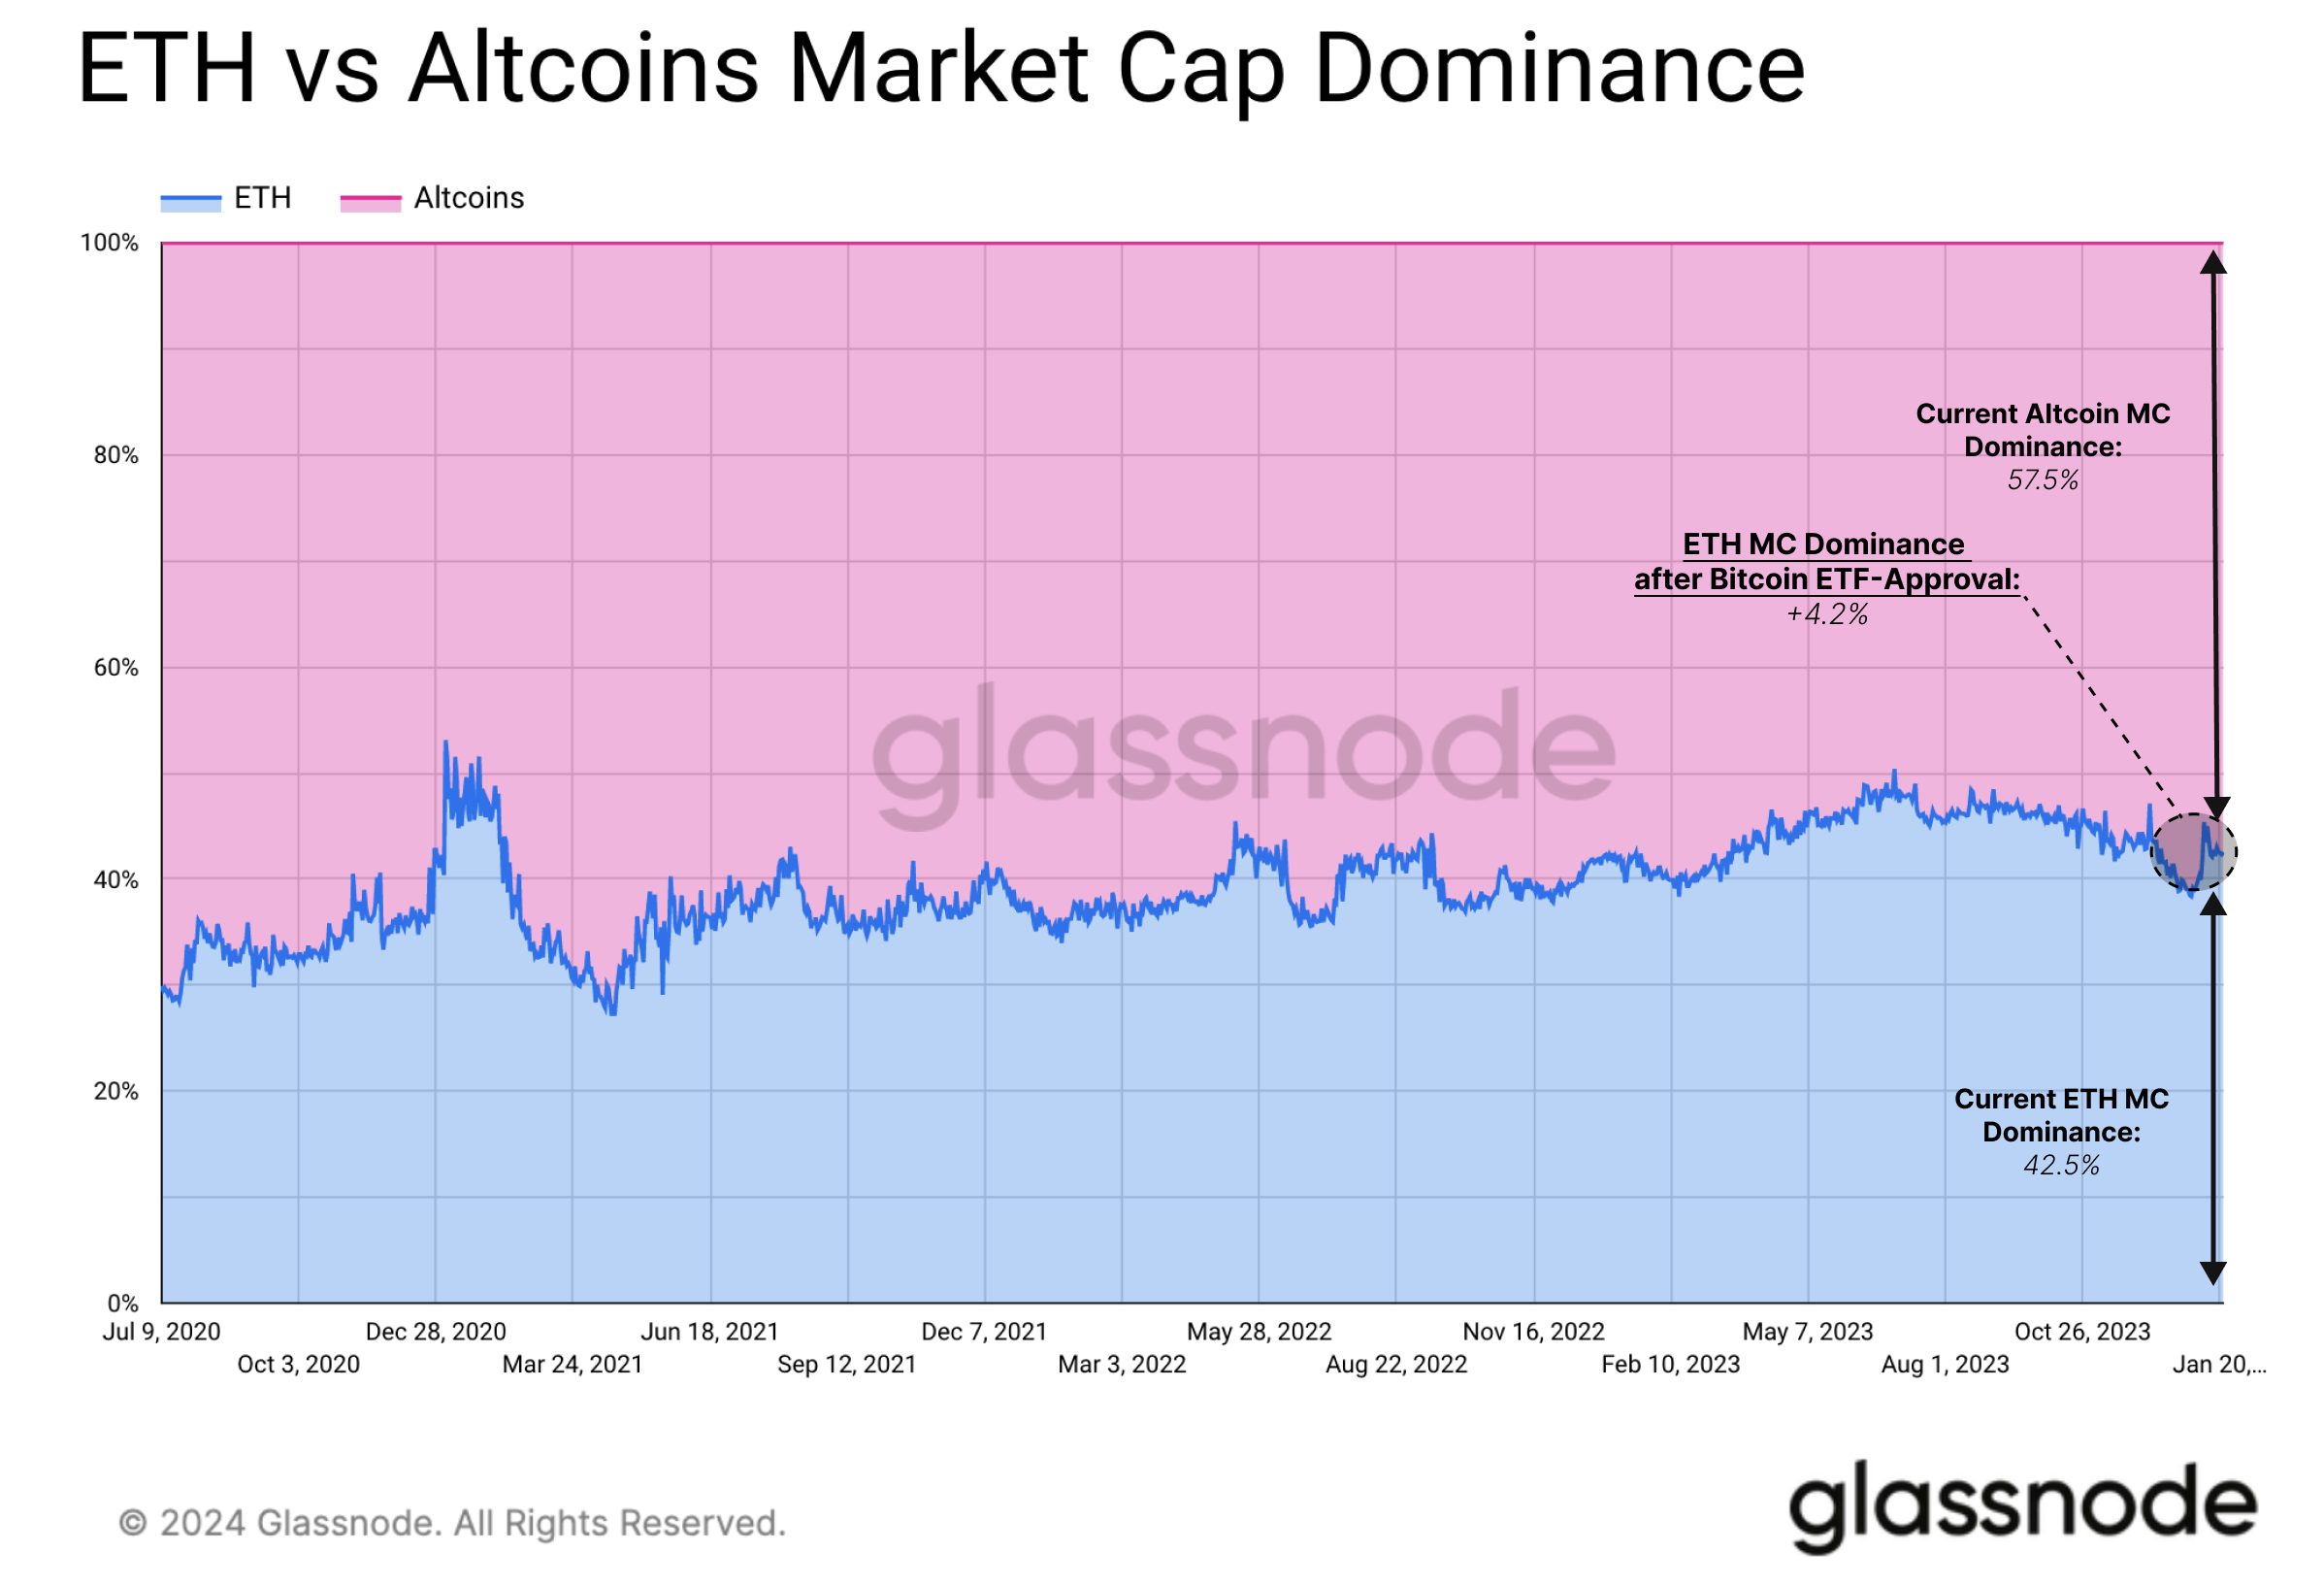
This coincides with a small rebound in the market cap dominance of both ETH and Altcoins in general. Compared to Bitcoin, ETH has gained 2.9% in market cap dominance.

Concurrently, the volume of net profits locked in by ETH investors has reached a new multi-year high. While profits taking has increased taken since mid-October, the peak on 13-Jan reached over $900M/day, aligned with investors capitalising on the 'sell-the-news' momentum.

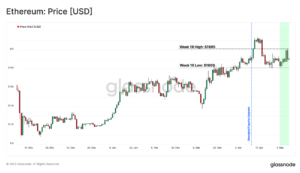
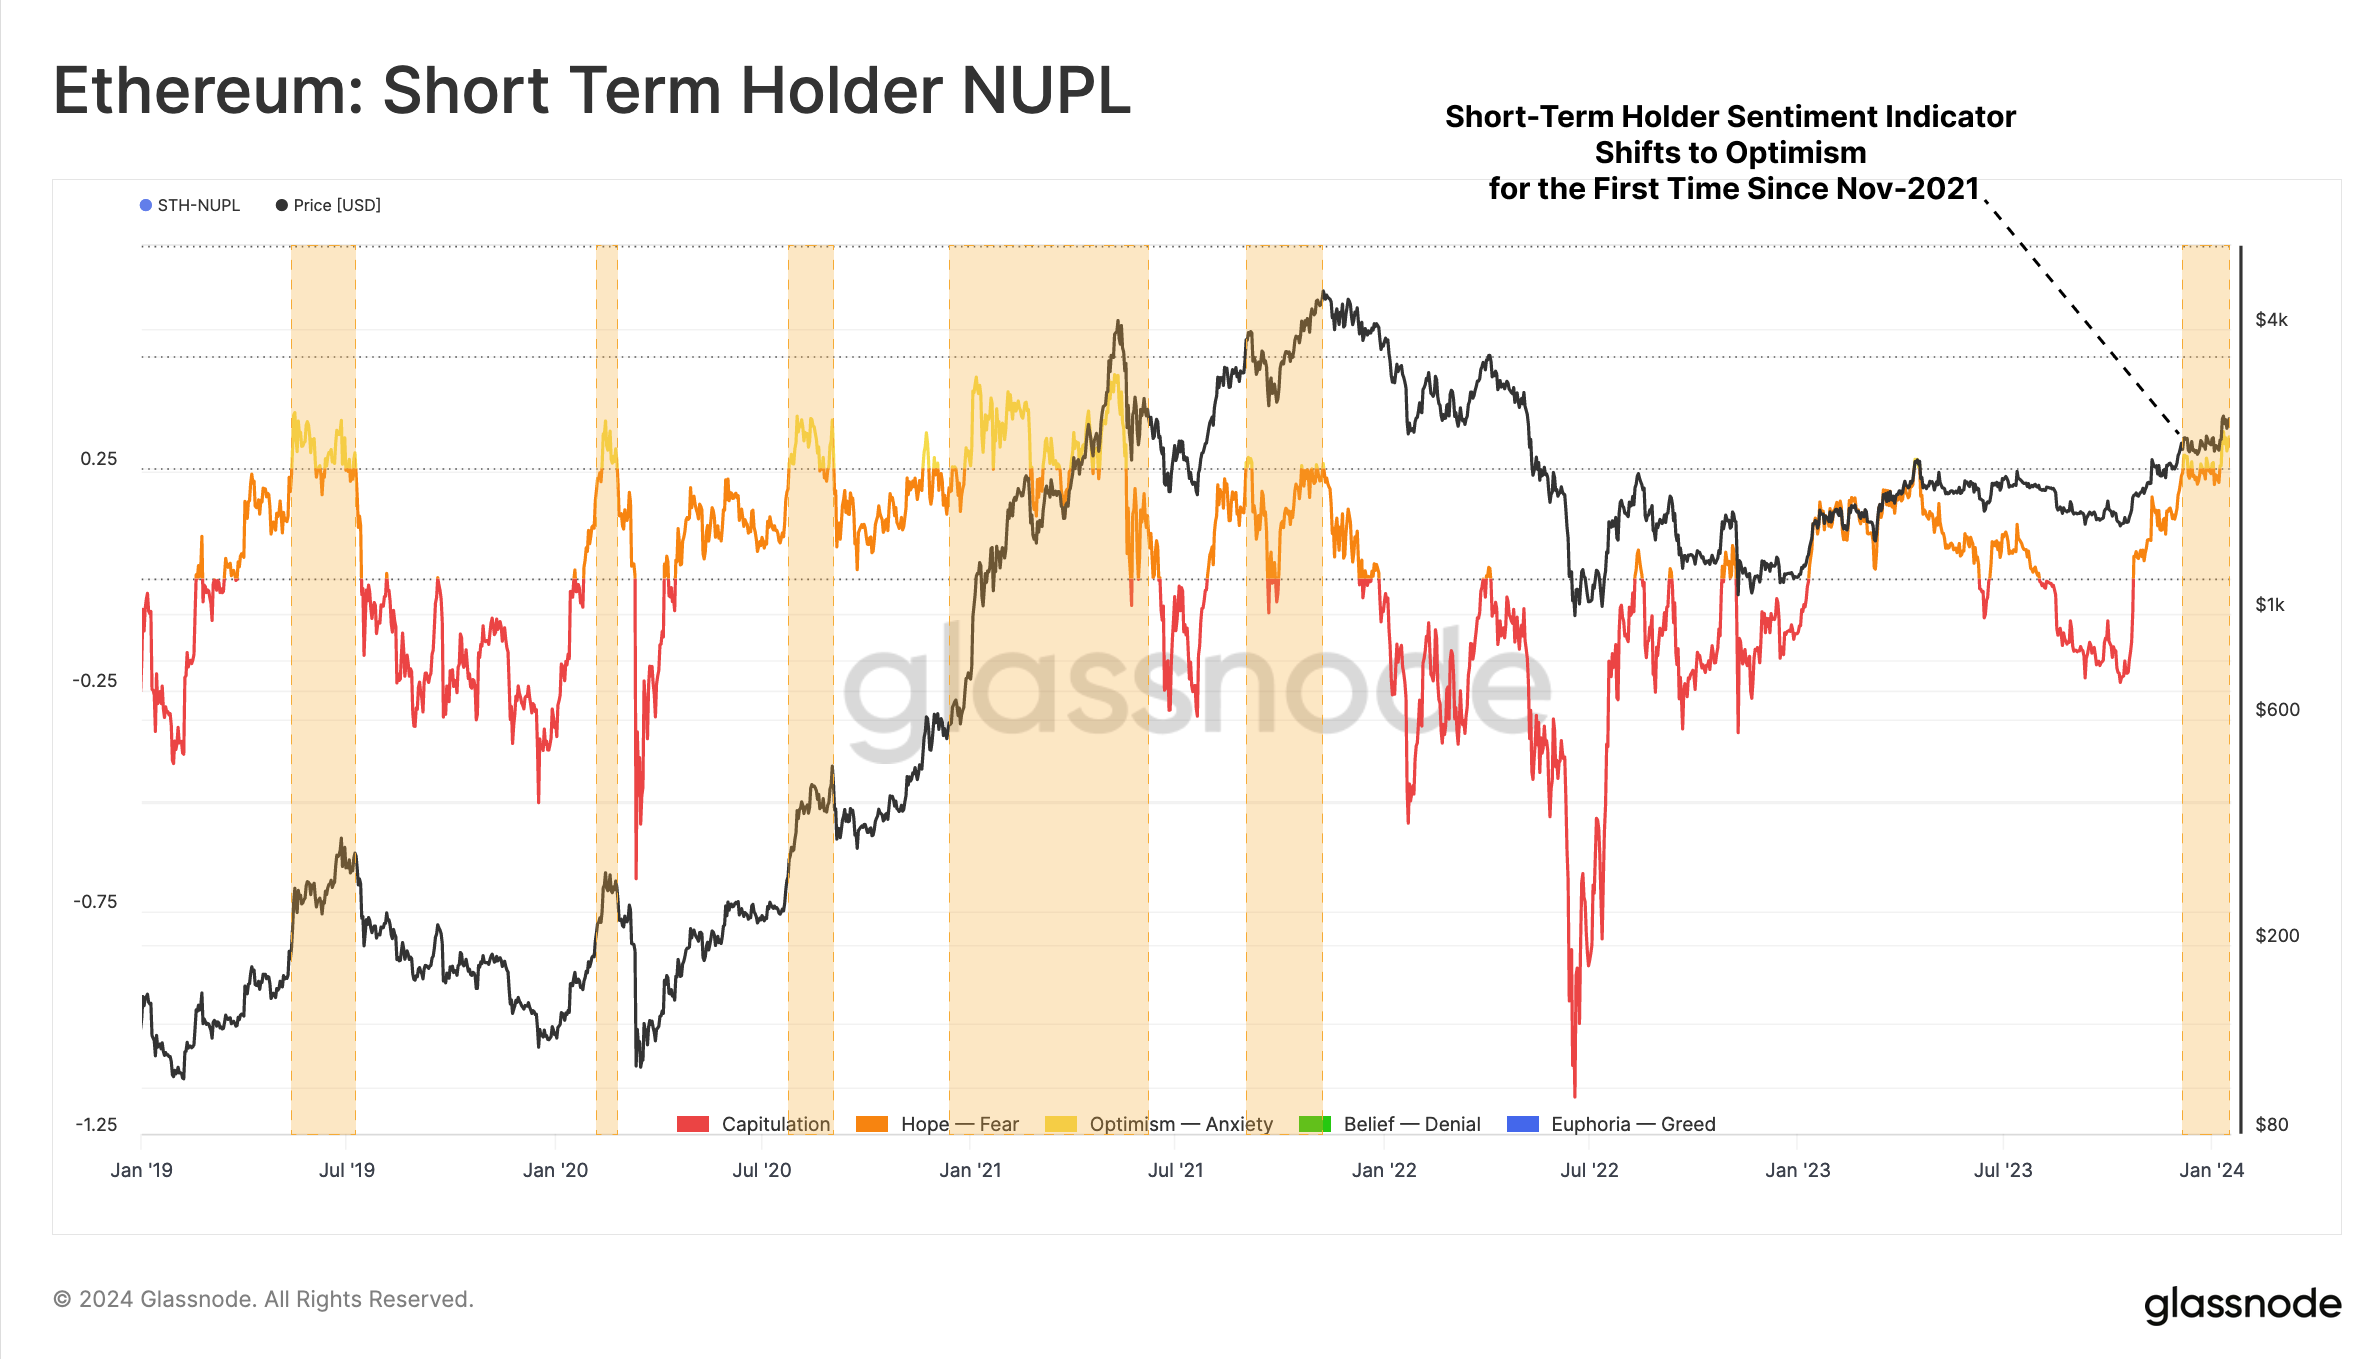
Positive market sentiment for ETH is supported by another indicator: Net Unrealized Profit/Loss (NUPL) for short-term token holders. STH-NUPL has crossed above 0.25 for the first time since the Nov-2021 ATH.
This suggests both a degree of optimistic market sentiment is creeping in for ETH but is also a level where markets tend to take a pause and digest profit taking distribution pressure. Historically, this type of sentiment shift for short-term holders has coincided with local peaks during a macro uptrend.
Derivatives Shift Focus
Given Ethereum's recent rally, it's worth examining its derivative markets to assess how leveraged markets are responding. In recent weeks we can see a meaningful uptick in trade volume for both futures and options contracts. Combined, ETH markets experienced a total trade volume of $21.3B/day, surpassing the average volume of 2023 ($13.9B), but it is still far from the typical levels seen in 2021 to 2022.

We can also compare the relative scale of ETH derivative markets to BTC, considering the dominance of futures open interest. BTC perpetual swaps accounted for 55% of open interest in Jan-2022, which has since risen to 66.2%.
Conversely, ETH open interest dominance decreased from 45% to 33.8% between 2022 and 2024. However, following the ETF approval, ETH regained some market share, with its dominance rebounding to ~40% by this metric.

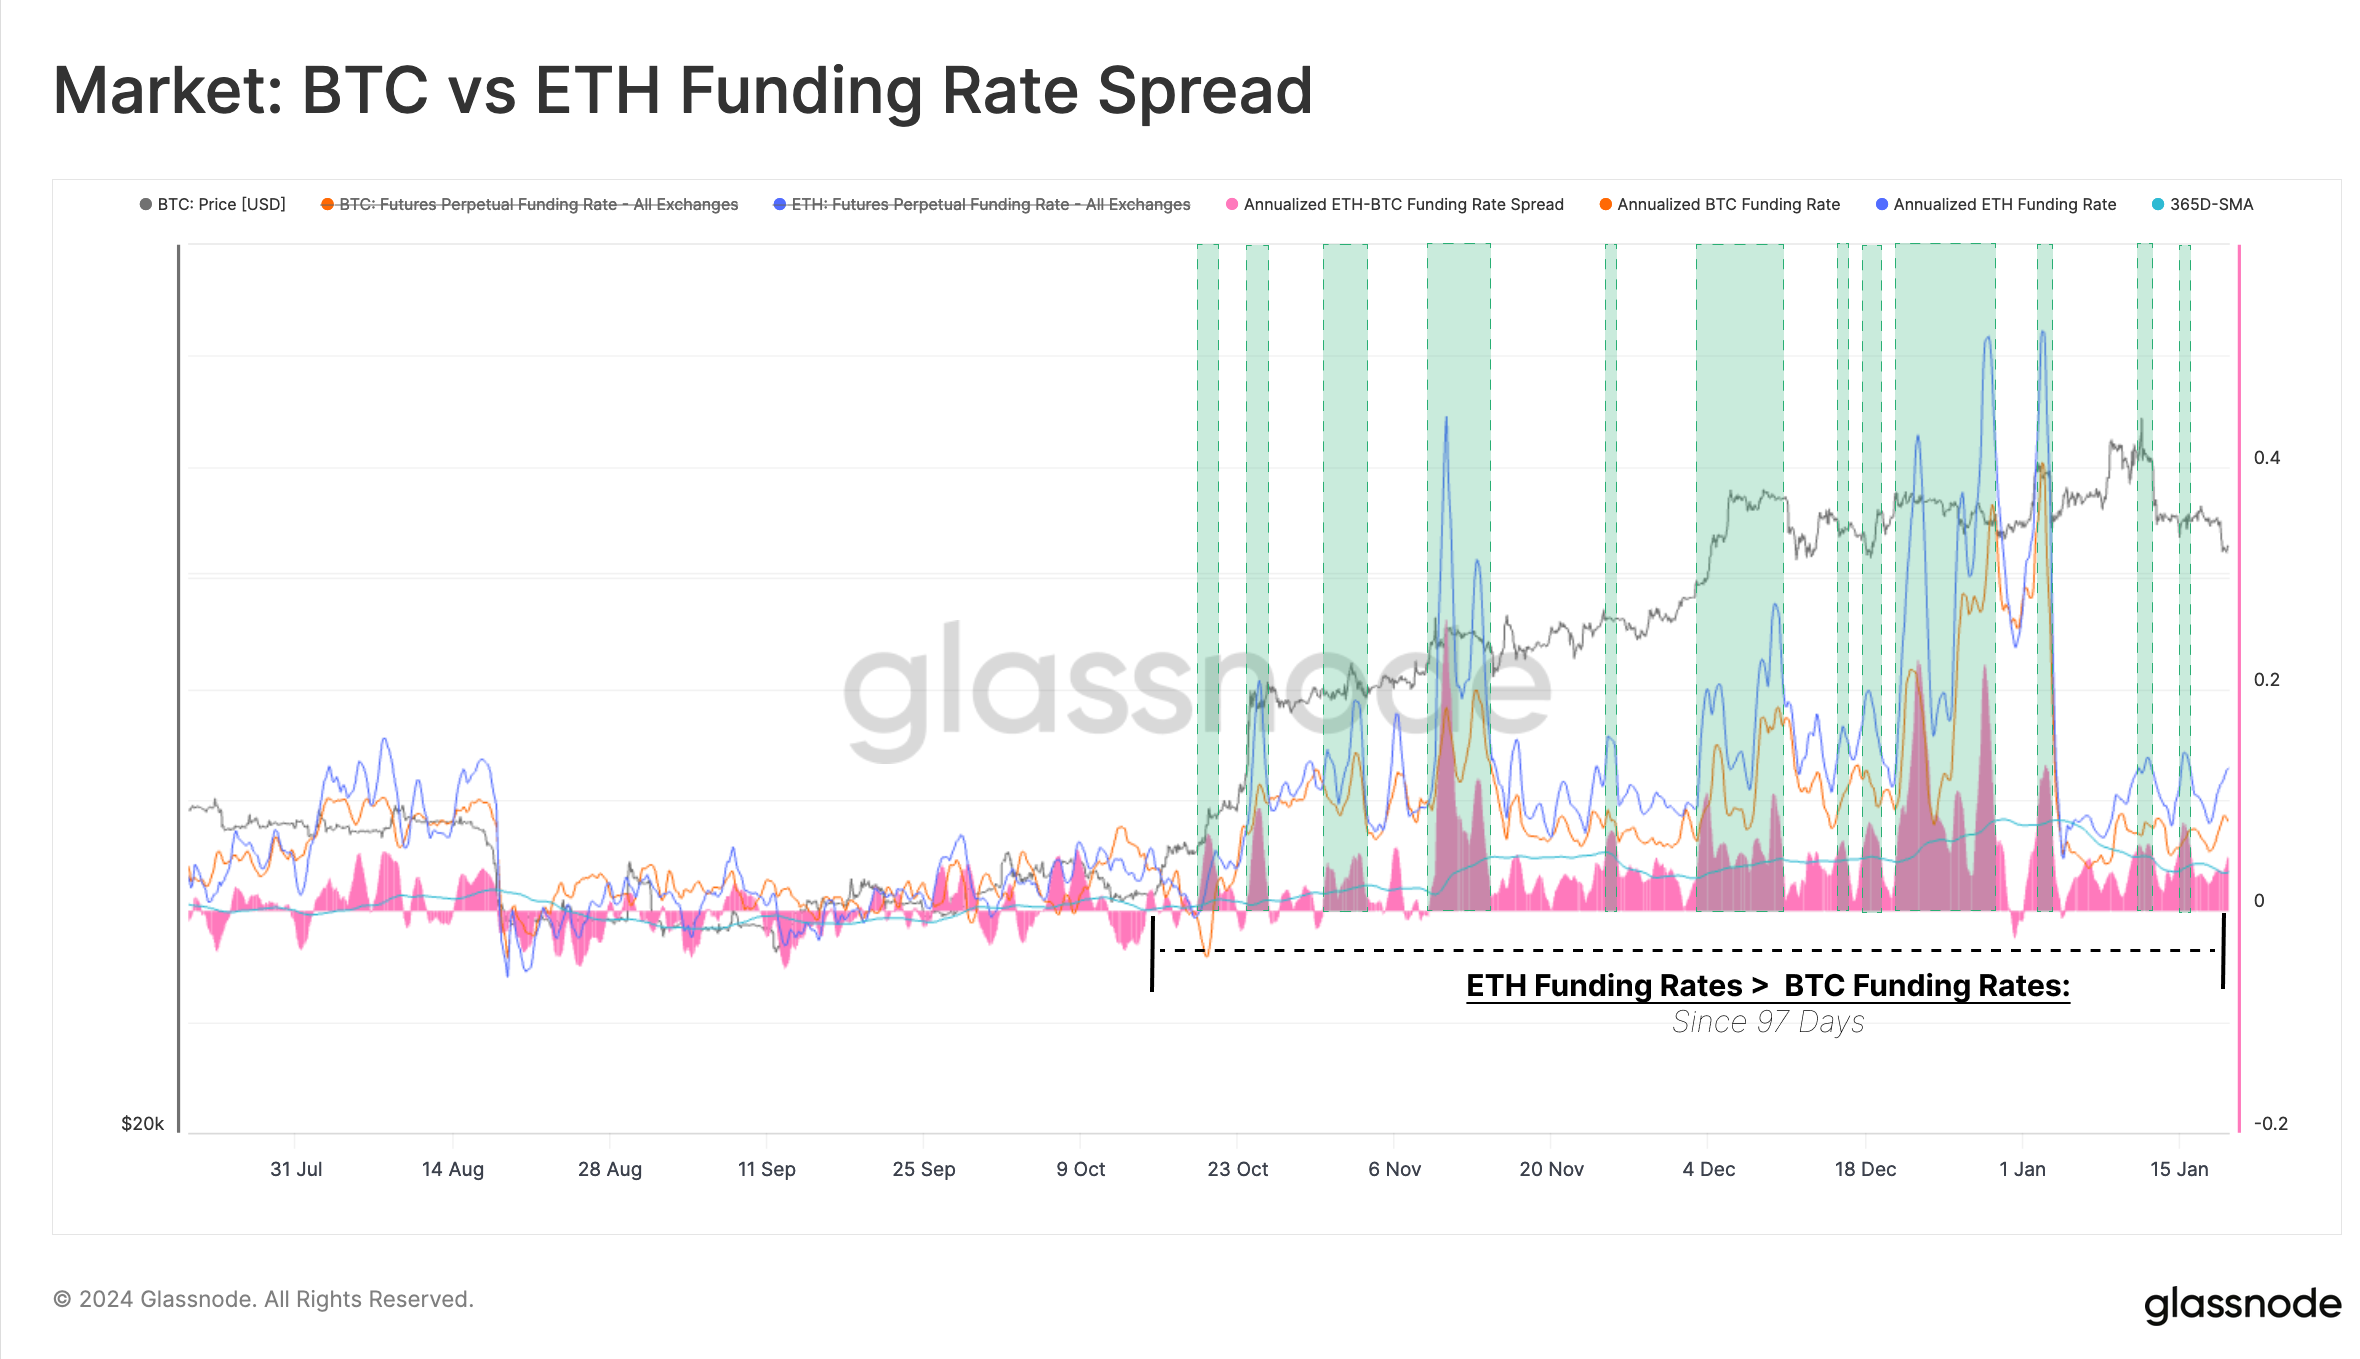
There is also a relatively larger funding rate premium for ETH futures, indicative of a relatively higher risk premium compared to Bitcoin. For the past three months, ETH funding rates have surpassed those of BTC, but did not increase meaningfully in recent weeks. This suggests that there is not yet a substantial rise in speculative interest betting on relatively higher price movements for Ether.
Interestingly, when the ETH-BTC funding rate spread spikes above its 1y average, it typically aligns with local peaks for ETH prices.
ETH or Altcoins?
Digital asset markets are extremely competitive, and ETH is not only fighting for capital flows vs Bitcoin, but also relative to other layer 1 blockchain tokens.
Solana (SOL) has been a major stand out in 2023, seeing outstanding price performance last year, despite significant setbacks due to its association with FTX. SOL has gained considerable market share over the last 12-months, with the SOL/BTC ratio fluctuating between 0.0011 and 0.0005 SOL/BTC.
The SOL/BTC ratio has increased by 290% since October 2023, and significantly outperformed ETH during this period. Interestingly, unlike ETH, SOL's price did not experience any significant upwards revaluation after the BTC ETF approvals.

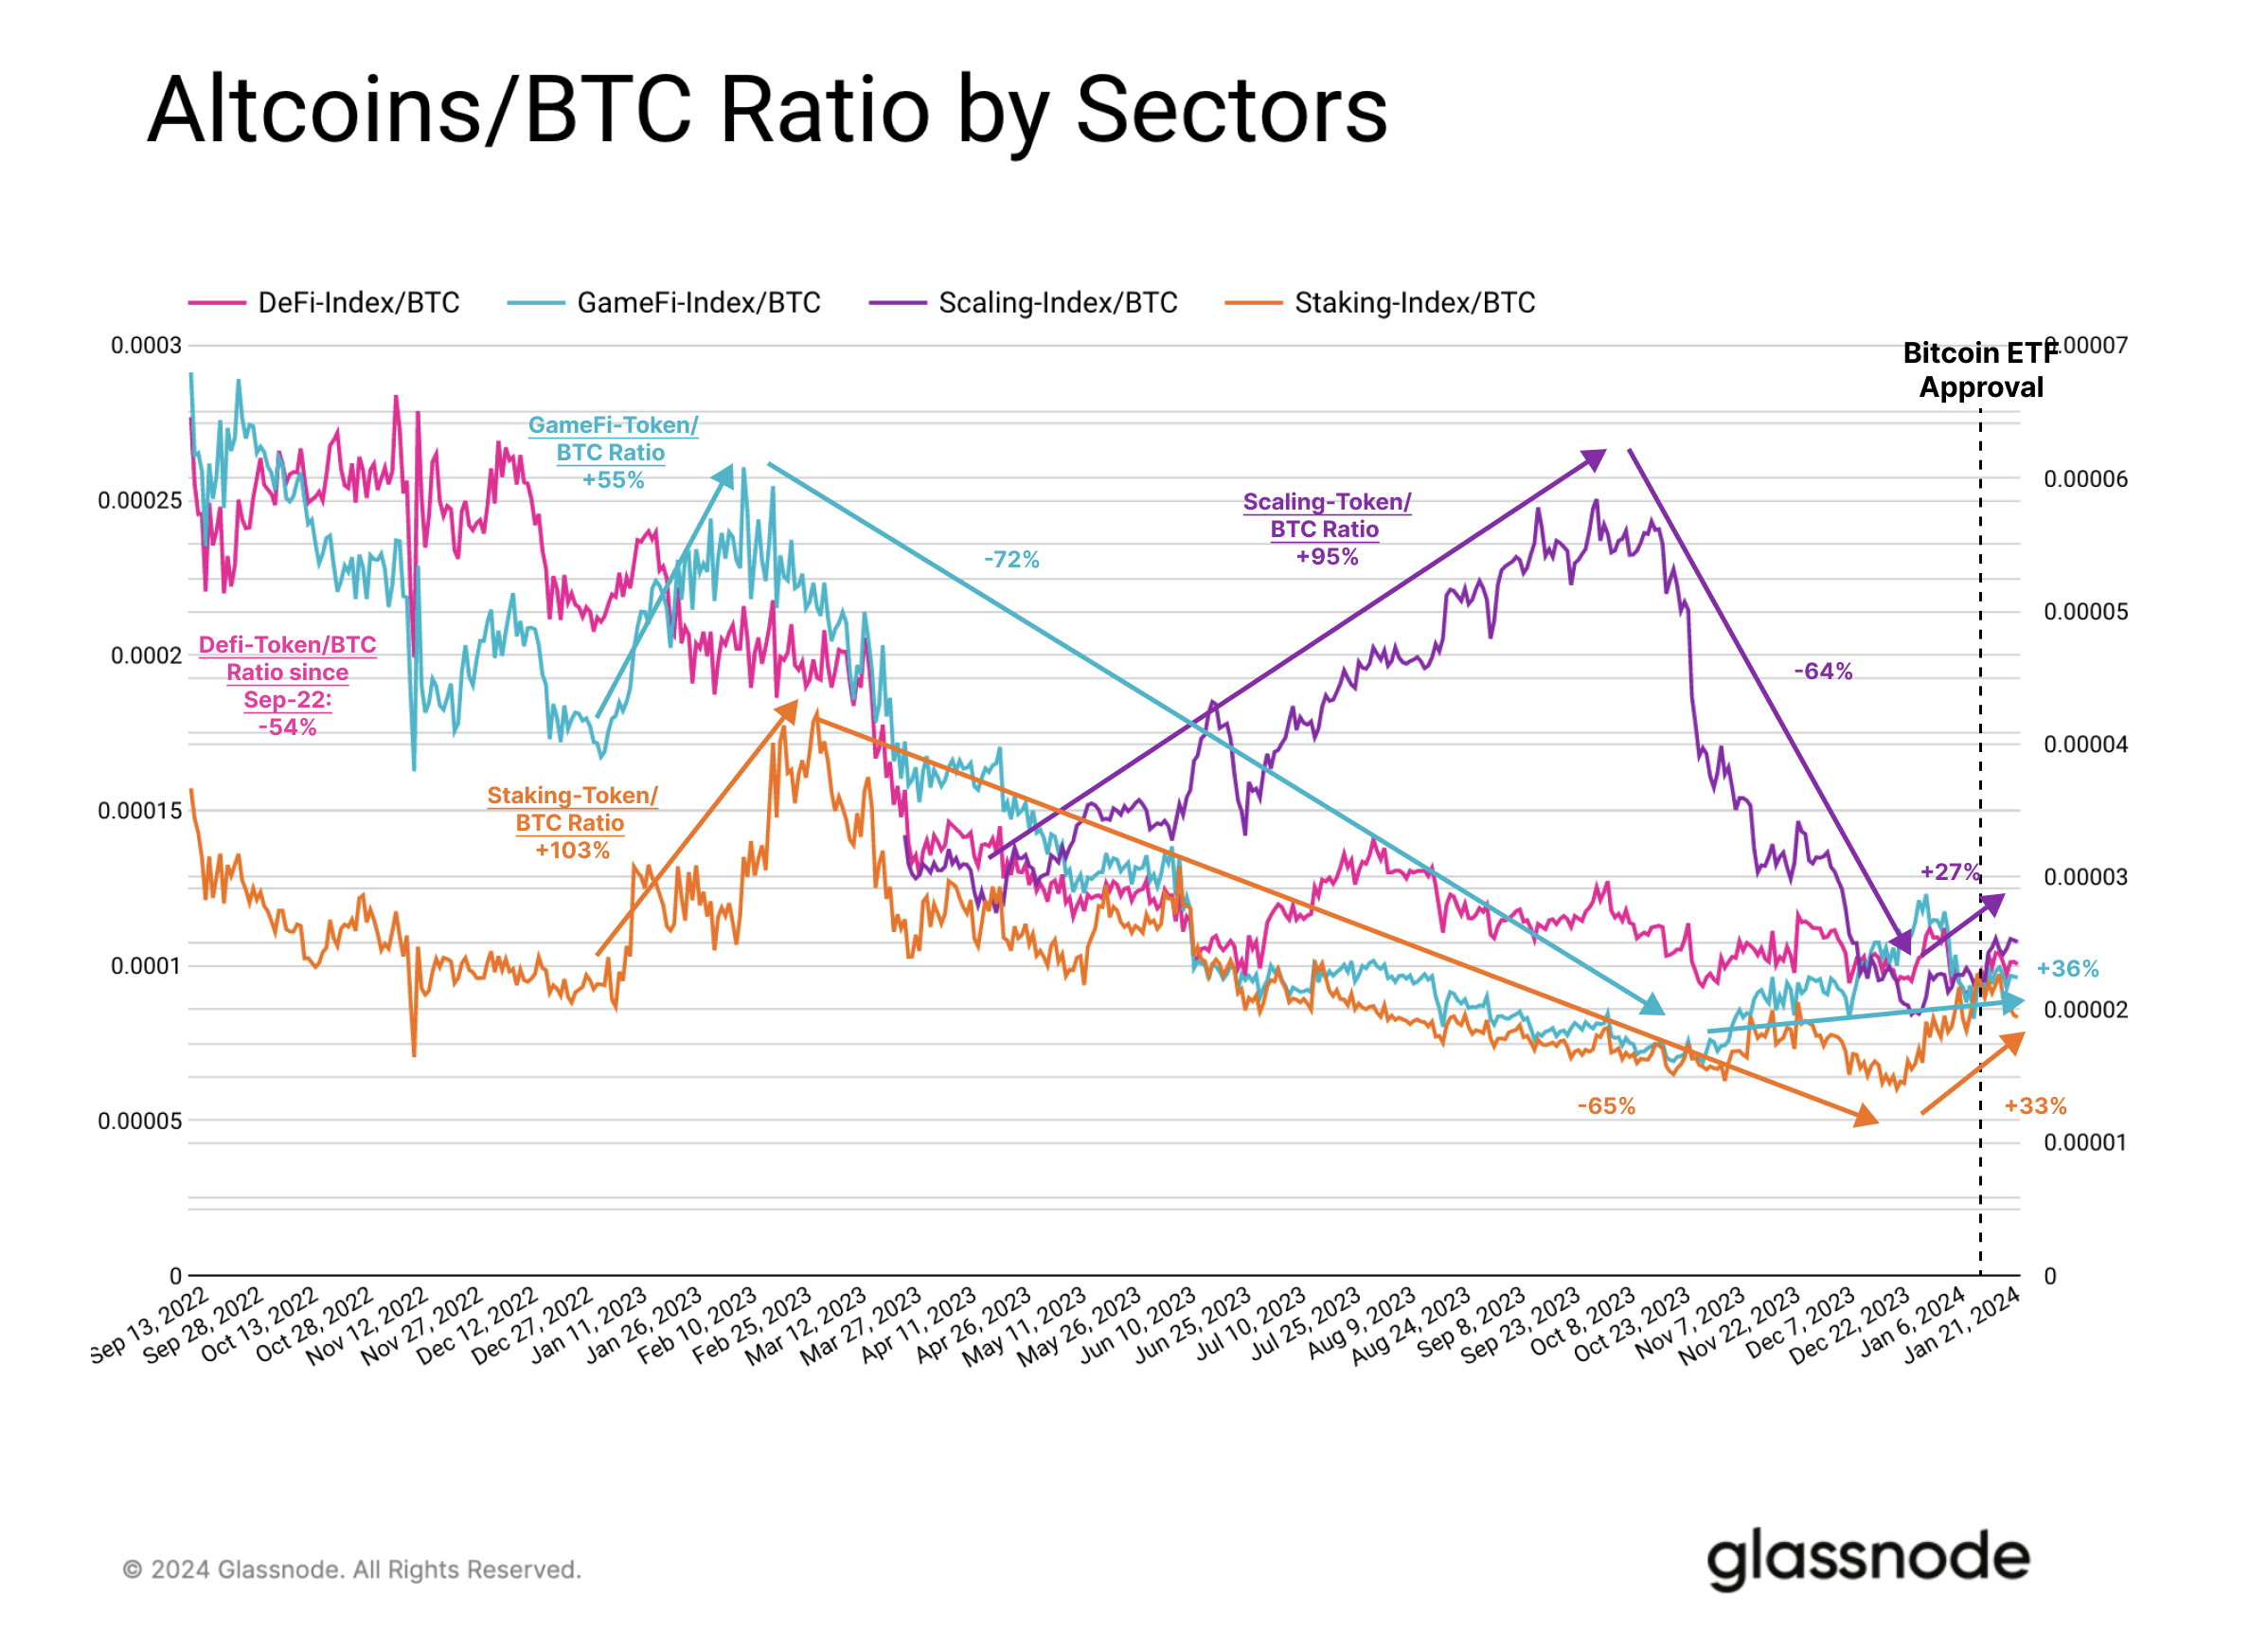
As stated at the start of this report, the Altcoin market cap has risen by nearly 69% since the BlackRock Bitcoin ETF filing. When we break down the Altcoin market into different sectors, it becomes clear that this trend has a primarily driver associated with tokens related to Ethereum scaling solutions such as OP, ARB, and MATIC.
Staking and GameFi tokens have also outperformed BTC since late last year. The Staking-Token/BTC Ratio rose by 103% in early 2023 but then fell by -65% until finding a bottom in December. Similarly, the GameFi-Token/BTC Ratio increased by +55% in Feb-2023 and has since decreased by -75%.
Scaling tokens reached their peak performance later in the year, seeing the Scaling-Token/BTC ratio rise by +95% in Q2 and Q3 2023. It is important to note that the Arbitrum token only launched in March 2023, being a likely trigger point for this outperformance.
All indexes experienced a slight increase after the approval of the Bitcoin ETF, another indication of some risk appetite as BTC sold off after the news.
However in comparison to ETH, Altcoins simply have not held up in recent weeks. ETH outperformed Altcoins generally, gaining +4.2% in global dominance. This makes ETH the biggest winner in the post-ETF approval market movements.
Summary and Conclusion
The approval of the new Bitcoin ETFs has bcome a classic sell-the-news event, leading to a tumultuous few weeks in the market. ETH has seen a burst of outperformance, emerging as the short-term winner. ETH investors have recorded a multi-year high in net realized profits, suggesting there is some willingness to sell-the-speculation on a potential ETH ETF capital rotation.
Solana has also become a strong competitor in the Layer 1 blockchain competition through 2023, although did not see any appreciable strength in recent weeks. The general Altcoin sector has also gained some momentum from the ETF excitement, with investors starting to front-run another speculative wave on the road ahead.
Disclaimer: This report does not provide any investment advice. All data is provided for information and educational purposes only. No investment decision shall be based on the information provided here and you are solely responsible for your own investment decisions.
Exchange balances presented are derived from Glassnode’s comprehensive database of address labels, which are amassed through both officially published exchange information and proprietary clustering algorithms. While we strive to ensure the utmost accuracy in representing exchange balances, it is important to note that these figures might not always encapsulate the entirety of an exchange’s reserves, particularly when exchanges refrain from disclosing their official addresses. We urge users to exercise caution and discretion when utilizing these metrics. Glassnode shall not be held responsible for any discrepancies or potential inaccuracies. Please read our Transparency Notice when using exchange data.

- SEO Powered Content & PR Distribution. Get Amplified Today.
- PlatoData.Network Vertical Generative Ai. Empower Yourself. Access Here.
- PlatoAiStream. Web3 Intelligence. Knowledge Amplified. Access Here.
- PlatoESG. Carbon, CleanTech, Energy, Environment, Solar, Waste Management. Access Here.
- PlatoHealth. Biotech and Clinical Trials Intelligence. Access Here.
- Source: https://insights.glassnode.com/the-week-onchain-week-04-2024/
- :has
- :is
- :not
- :where
- $UP
- 1
- 13
- 2%
- 2000
- 2021
- 2022
- 2023
- 2024
- 24
- 25
- 28
- 33
- 49
- 66
- 7
- a
- above
- accounted
- accuracy
- activity
- address
- addresses
- advanced
- advice
- advocate
- After
- aggregate
- ahead
- algorithms
- aligned
- Aligns
- All
- also
- Altcoin
- Altcoins
- Although
- always
- amassed
- an
- and
- Another
- any
- appeared
- appetite
- approval
- approvals
- arbitrum
- ARE
- arguably
- AS
- asking
- assess
- asset
- associated
- Association
- At
- ATH
- average
- balances
- based
- basis
- BE
- become
- becomes
- been
- being
- Betting
- between
- Biggest
- Bitcoin
- Bitcoin ETF
- Bitcoin prices
- BlackRock
- blockchain
- Blockchain Competition
- both
- Bottom
- Break
- BTC
- BTC ETF
- BTC Perpetual
- but
- by
- CAN
- cap
- capital
- capitalising
- caution
- challenging
- classic
- clear
- clustering
- coincided
- coincides
- Collapse
- combined
- compare
- compared
- comparison
- competition
- competitive
- competitor
- comprehensive
- considerable
- considering
- continue
- contract
- contracts
- Crossed
- crypto
- Crypto Markets
- data
- Database
- Days
- December
- decision
- decisions
- decreased
- Degree
- derivative
- Derivatives
- Derived
- Despite
- DID
- different
- Digest
- digital
- Digital Asset
- Disclosing
- discretion
- discussed
- distribution
- does
- Dominance
- dominant
- dominated
- down
- driver
- Dropping
- due
- during
- Early
- edition
- educational
- emerging
- ensure
- entirety
- ETF
- ETFs
- ETH
- eth and btc
- ETH funding rates
- Ether
- ethereum
- ethereum scaling
- Event
- Examining
- exchange
- Exchanges
- Excitement
- Exercise
- experience
- experienced
- express
- extremely
- Fallen
- far
- few
- fighting
- Figures
- filed
- Filing
- finding
- First
- first time
- Flows
- followed
- following
- For
- from
- FTX
- ftx collapse
- funding
- funding rates
- Futures
- gained
- gaining
- Gamefi
- gauge
- General
- generally
- Glassnode
- Global
- Ground
- had
- hand
- Have
- Held
- here
- High
- higher
- historically
- holders
- How
- However
- HTTPS
- important
- in
- Increase
- increased
- increasingly
- indexes
- indication
- indicative
- Indicator
- information
- interest
- into
- investment
- Investors
- issuers
- IT
- ITS
- Labels
- larger
- Last
- Last Year
- Late
- later
- launched
- layer
- layer 1
- layer 1 blockchain
- leading
- Level
- levels
- leveraged
- likely
- local
- locked
- Look
- lost
- Low
- Macro
- mainly
- major
- MAKES
- Making
- managed
- March
- Market
- Market Cap
- market sentiment
- market share
- Markets
- Matic
- meaningful
- metric
- Metrics
- might
- Momentum
- monthly
- months
- more
- movements
- multi-year
- narratives
- Near
- nearly
- net
- New
- news
- next
- no
- note
- Notice..
- November
- now
- NUPL
- obtaining
- october
- of
- off
- official
- Officially
- on
- only
- OP
- open
- open interest
- Optimism
- Optimistic
- Options
- or
- Other
- our
- out
- Outperform
- outperformed
- outstanding
- over
- own
- particularly
- past
- pause
- Peak
- perfection
- performance
- period
- Perpetual
- perpetual swaps
- plato
- Plato Data Intelligence
- PlatoData
- playing
- Point
- possible
- possibly
- potential
- Premium
- presented
- pressure
- price
- Prices
- primarily
- Profit
- profits
- proprietary
- provide
- provided
- published
- purposes
- Q2
- Q3
- quarterly
- question
- rally
- ranging
- Rate
- Rates
- ratio
- reached
- Read
- realized
- rebound
- recent
- recorded
- regarding
- related
- relative
- relatively
- remains
- report
- representing
- reserves
- responding
- response
- responsible
- Rise
- Risen
- rising
- Risk
- risk appetite
- road
- ROSE
- round
- s
- Scale
- scaling
- SEC
- sector
- Sectors
- see
- seeing
- seen
- sentiment
- Setbacks
- several
- Share
- shift
- short-term
- significant
- significantly
- Similarly
- simply
- since
- sluggish
- small
- smaller
- SOL
- SOL/BTC
- Solana
- sold
- solely
- Solutions
- some
- Space
- speculation
- speculative
- spikes
- Spot
- spot etf
- spread
- Stablecoins
- stand
- start
- Starting
- stated
- Still
- strength
- strive
- strong
- strongest
- strongly
- substantial
- such
- Suggests
- Suit
- suite
- Supported
- Surged
- surpassed
- surpassing
- Swaps
- Take
- taken
- taking
- tend
- that
- The
- the information
- their
- then
- There.
- These
- this
- those
- three
- Through
- time
- to
- token
- token holders
- Tokens
- Total
- trade
- Transparency
- Trend
- trigger
- type
- typical
- typically
- unlike
- until
- uptrend
- upwards
- users
- using
- Utilizing
- utmost
- various
- very
- volume
- volumes
- vs
- Wave
- we
- week
- weekly
- Weeks
- when
- which
- while
- WHO
- wider
- will
- Willingness
- winner
- with
- world
- worth
- writing
- year
- years
- yet
- you
- Your
- zephyrnet