Executive Summary
- Bitcoin price performance since the 2022 lows shows striking similarity to prior cycles, albeit recovering somewhat slower, but in a more resilient manner.
- Despite a modest uptick in older coin spending following ETF approvals, the majority of long-term Bitcoin investors remain unwilling to part with their coins at current prices.
- Network activity remains low in terms of entities, but monetary volume transferred on-chain, and specifically to exchanges remains robust, and resembles prior bull market cycles.
Cycle Positioning
The first chart assesses BTC price performance since the previous ATH. In this instance, we consider April 2021 (the Coinbase direct listing) as the ATH for a better read on duration, since we argue that was the peak in terms of investor sentiment (WoC -4-2022).
The notion of history rhyming rings strikingly true, with the last 3 cycles experiencing eerily similar performance. Our current cycle remains marginally ahead of both the 2016-17 and 2019-20 periods, due in part to an extremely strong year in 2023.
🔴 Cycle 2: 45.7% below ATH
🔵 Cycle 3: 43.6% below ATH
⚫ Current Cycle: 37.3% below ATH
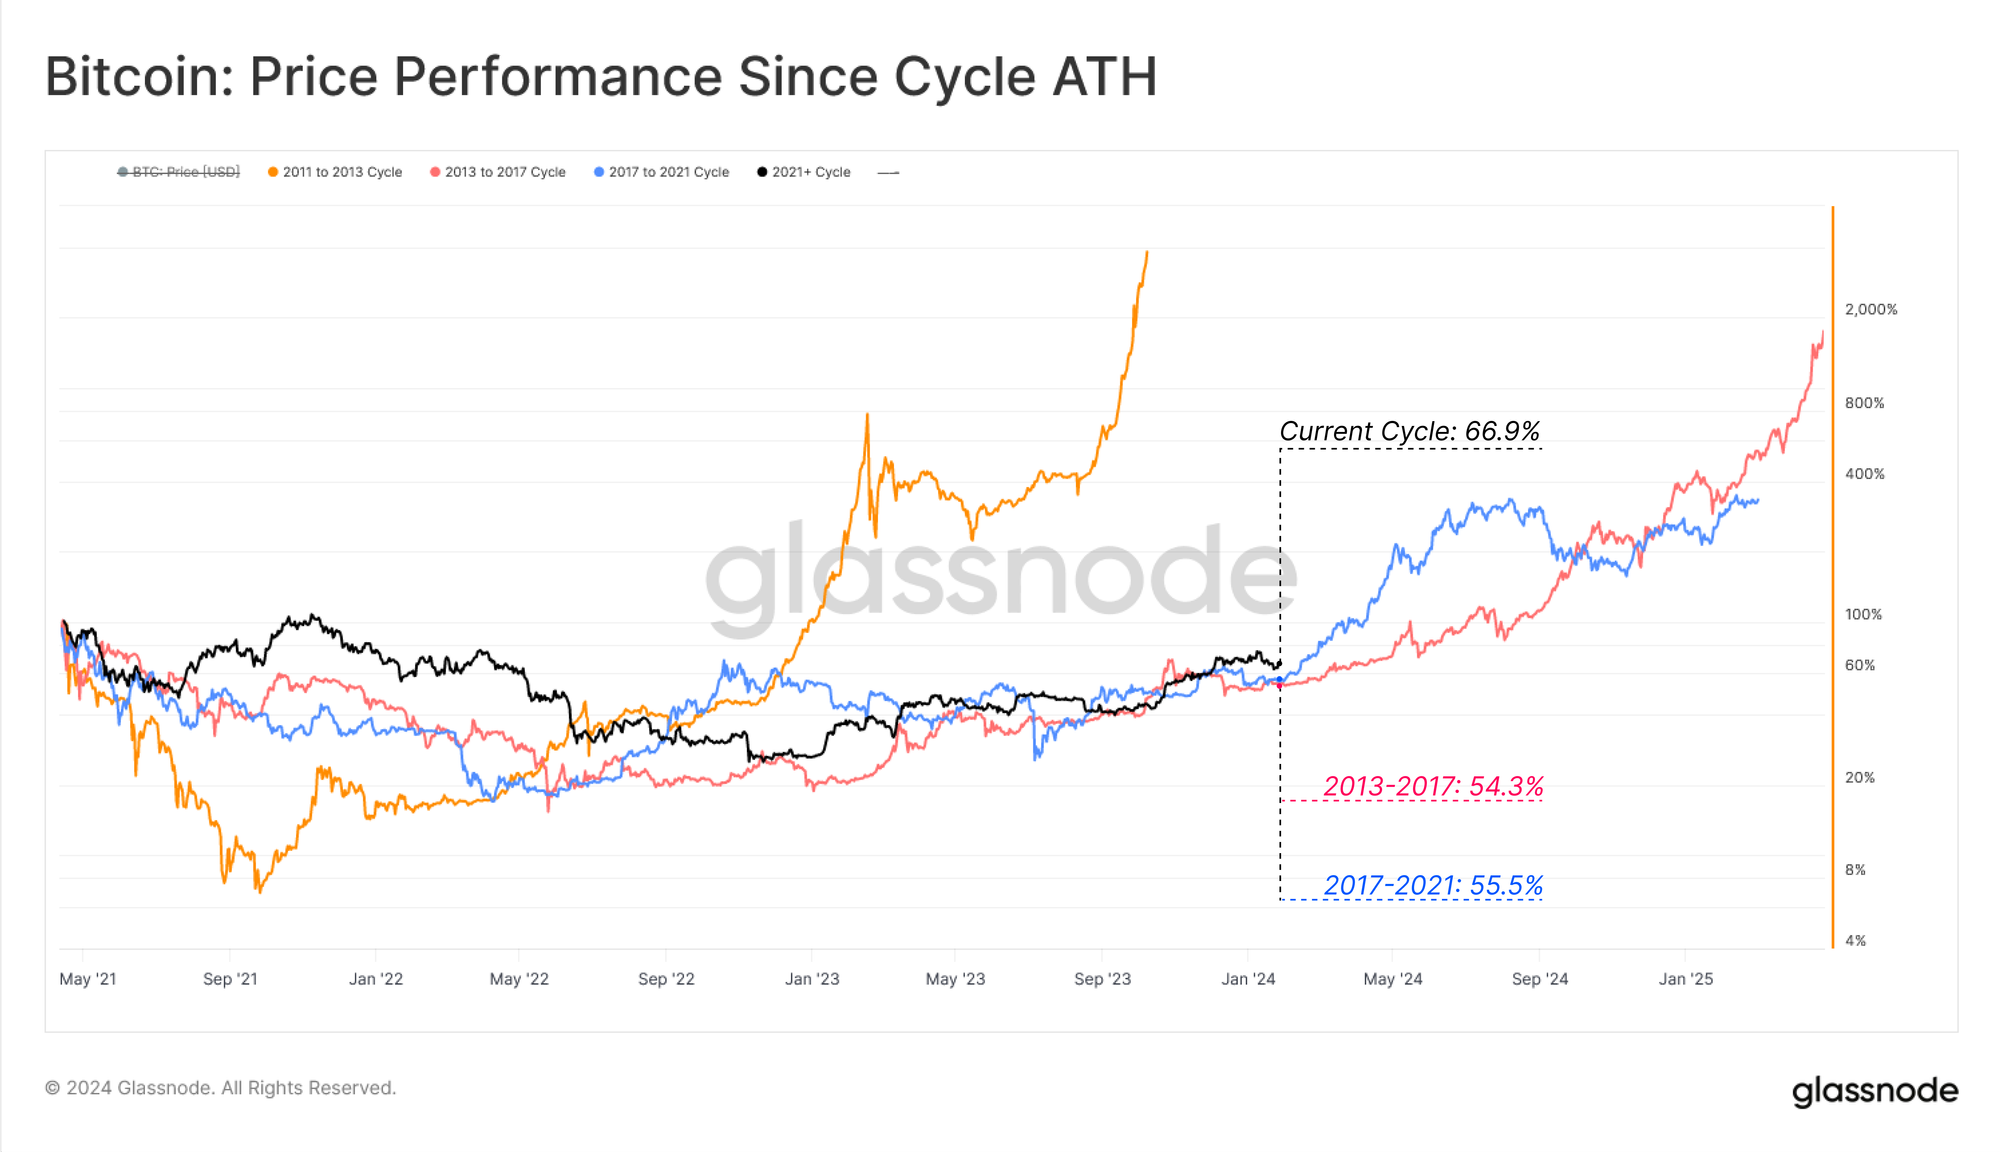
However, a heightened level of resilience can be noted across our current cycle, with corrections from the local high remaining relatively shallow. The largest drawdown thus far has been -20.1% set in August 2023.
This insight becomes increasingly pronounced when we count the proportion of days which traded at a deeper correction by comparison:
🟠 Genesis to 2011: 164-of-294 days (55.7%)
🔴 2011 to 2013: 352-of-741 days (47.5%)
🔵 2015 to 2017: 222-of-1066 days (20.8%)
🟢 2018 to 2021: 514-of-1056 days (48.7%)

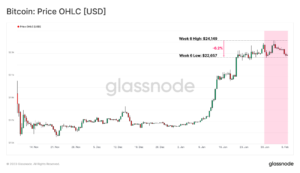
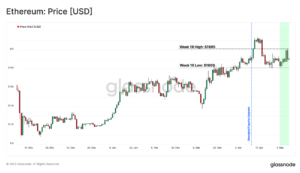
Despite this resilience, price momentum has been to the downside over recent weeks, as the market digests the new dynamics of the spot ETFs.
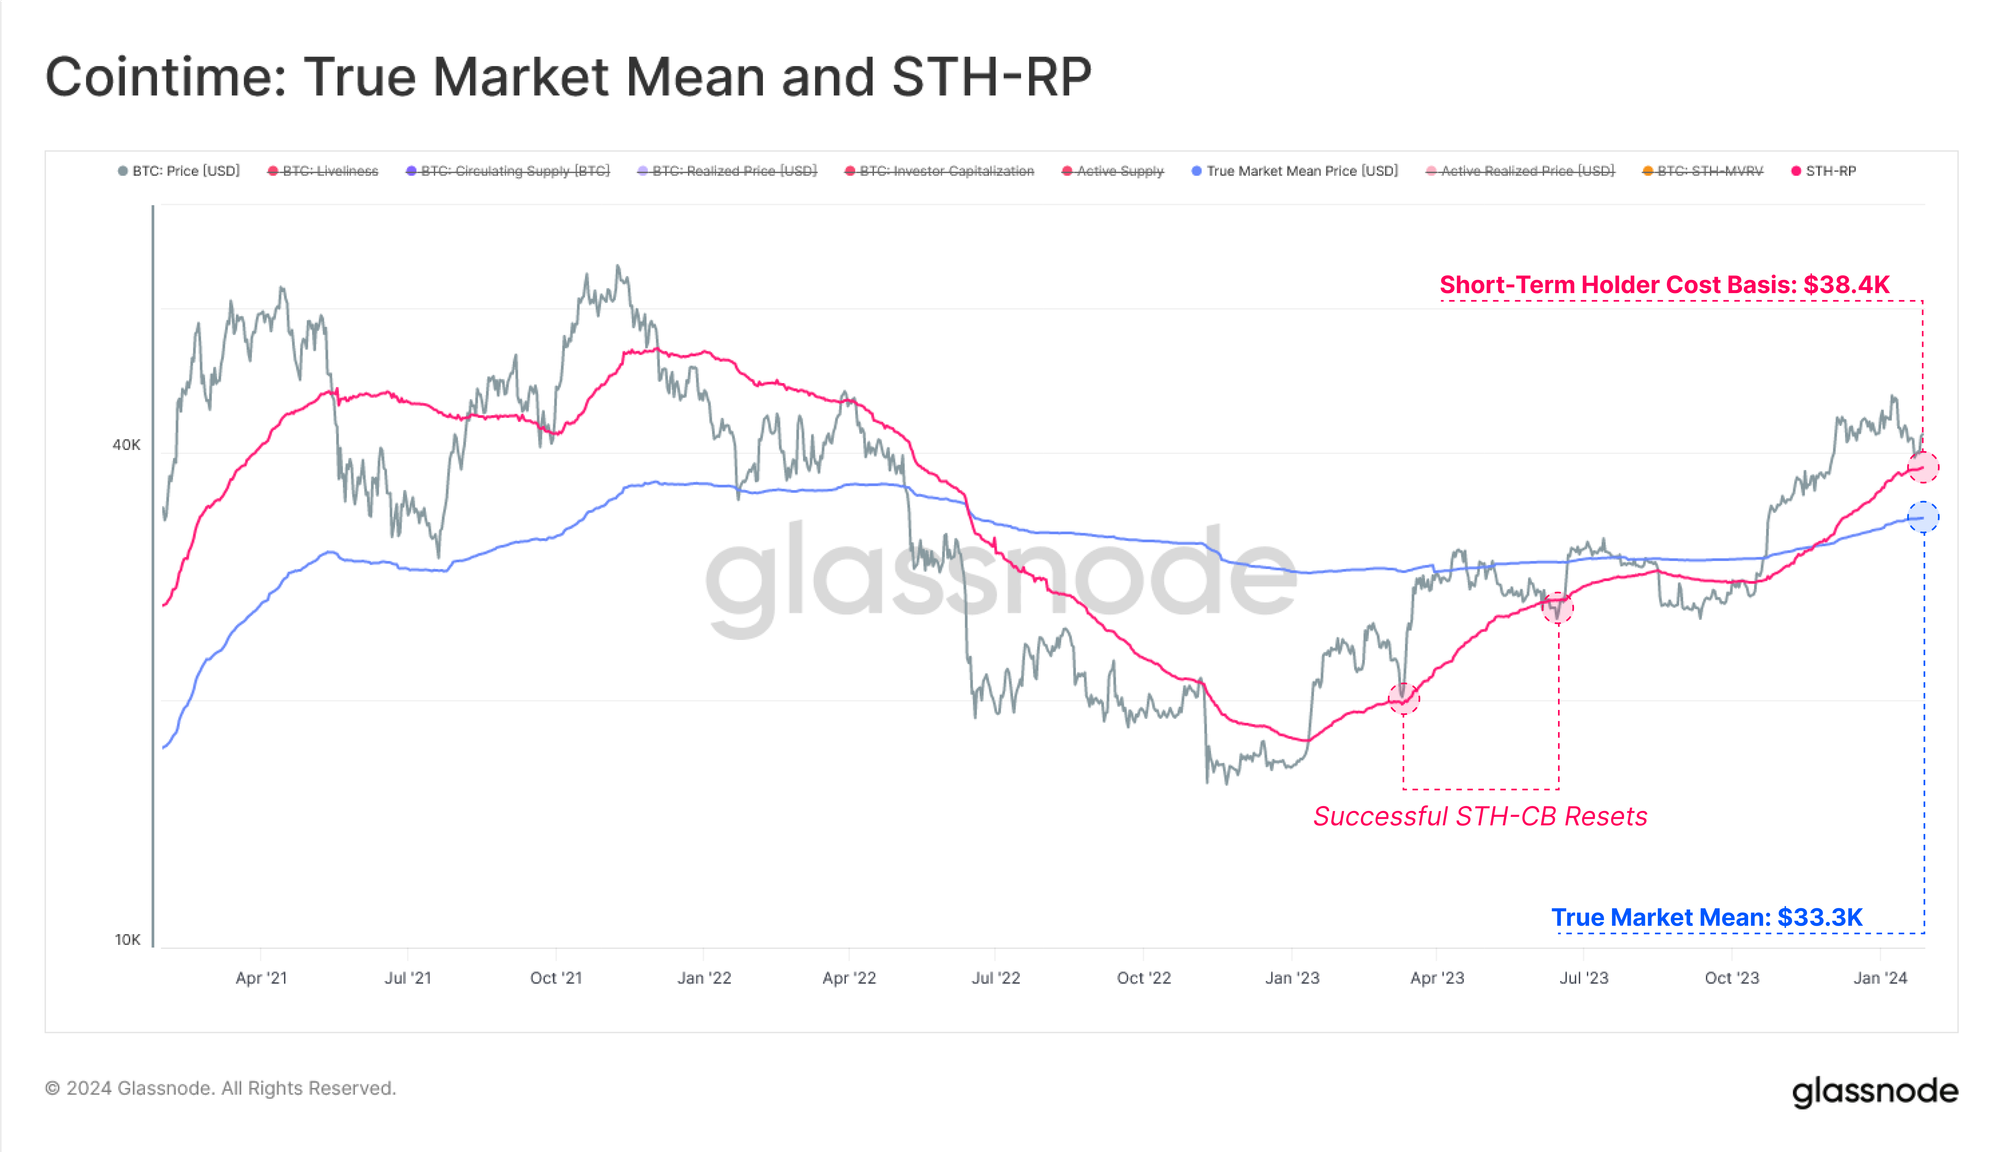
Here, we consult two key on-chain levels:
- 🔴 Short-Term Holder Cost Basis ($38.3k), describing the average acquisition price of new demand.
- 🔵 True Market Mean Price ($33.3k), a cost basis model for active investors.
Retests of the STH Cost basis as support are typical during market uptrends, however, a decisive loss of this level would bring the True Market Mean into consideration. The True Market Mean Price is very much a ‘centroid’ of the Bitcoin market, often distinguishing bull markets, from bear markets.
Recovery Meets the GBTC Overhang
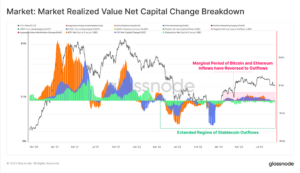
We can assess both the severity of capital outflows across cycles, as well as the recovery duration by utilzing the fundamental Realized Cap metric.
The Realized Cap remains just -5.4% shy of its previous ATH of $467B, and is currently experiencing strong capital inflows. That said, the duration for this recovery to accelerate has been markedly slower than prior cycles, arguably due to the significant supply overhang from challenging trades like the GBTC arbitrage.
The current cycle has seen the Realized Cap recover at the slowest pace on record
- 🥇 2012-13 Cycle 0.22% per day
- 🥉 2015-16 Cycle: 0.09% per Day
- 🥈 2019-20 Cycle: 0.17% per Day
- 🐢 2023-24 Cycle: 0.05% per Day

This phenomena can in part be attributed to the significant redemptions taking place from the Grayscale GBTC product. As a closed end trust fund, GBTC amassed an extraordinary 661.7k BTC in early 2021, as traders sought to close the NAV premium arbitrage.
After many years of trading at a severe NAV discount (with a very high 2% fee), conversion to a spot ETF has triggered significant a re-balancing event. Around ~115.6k BTC have been redeemed from the GBTC ETF since conversion, creating significant market headwinds.

HODLers Won’t Let Up
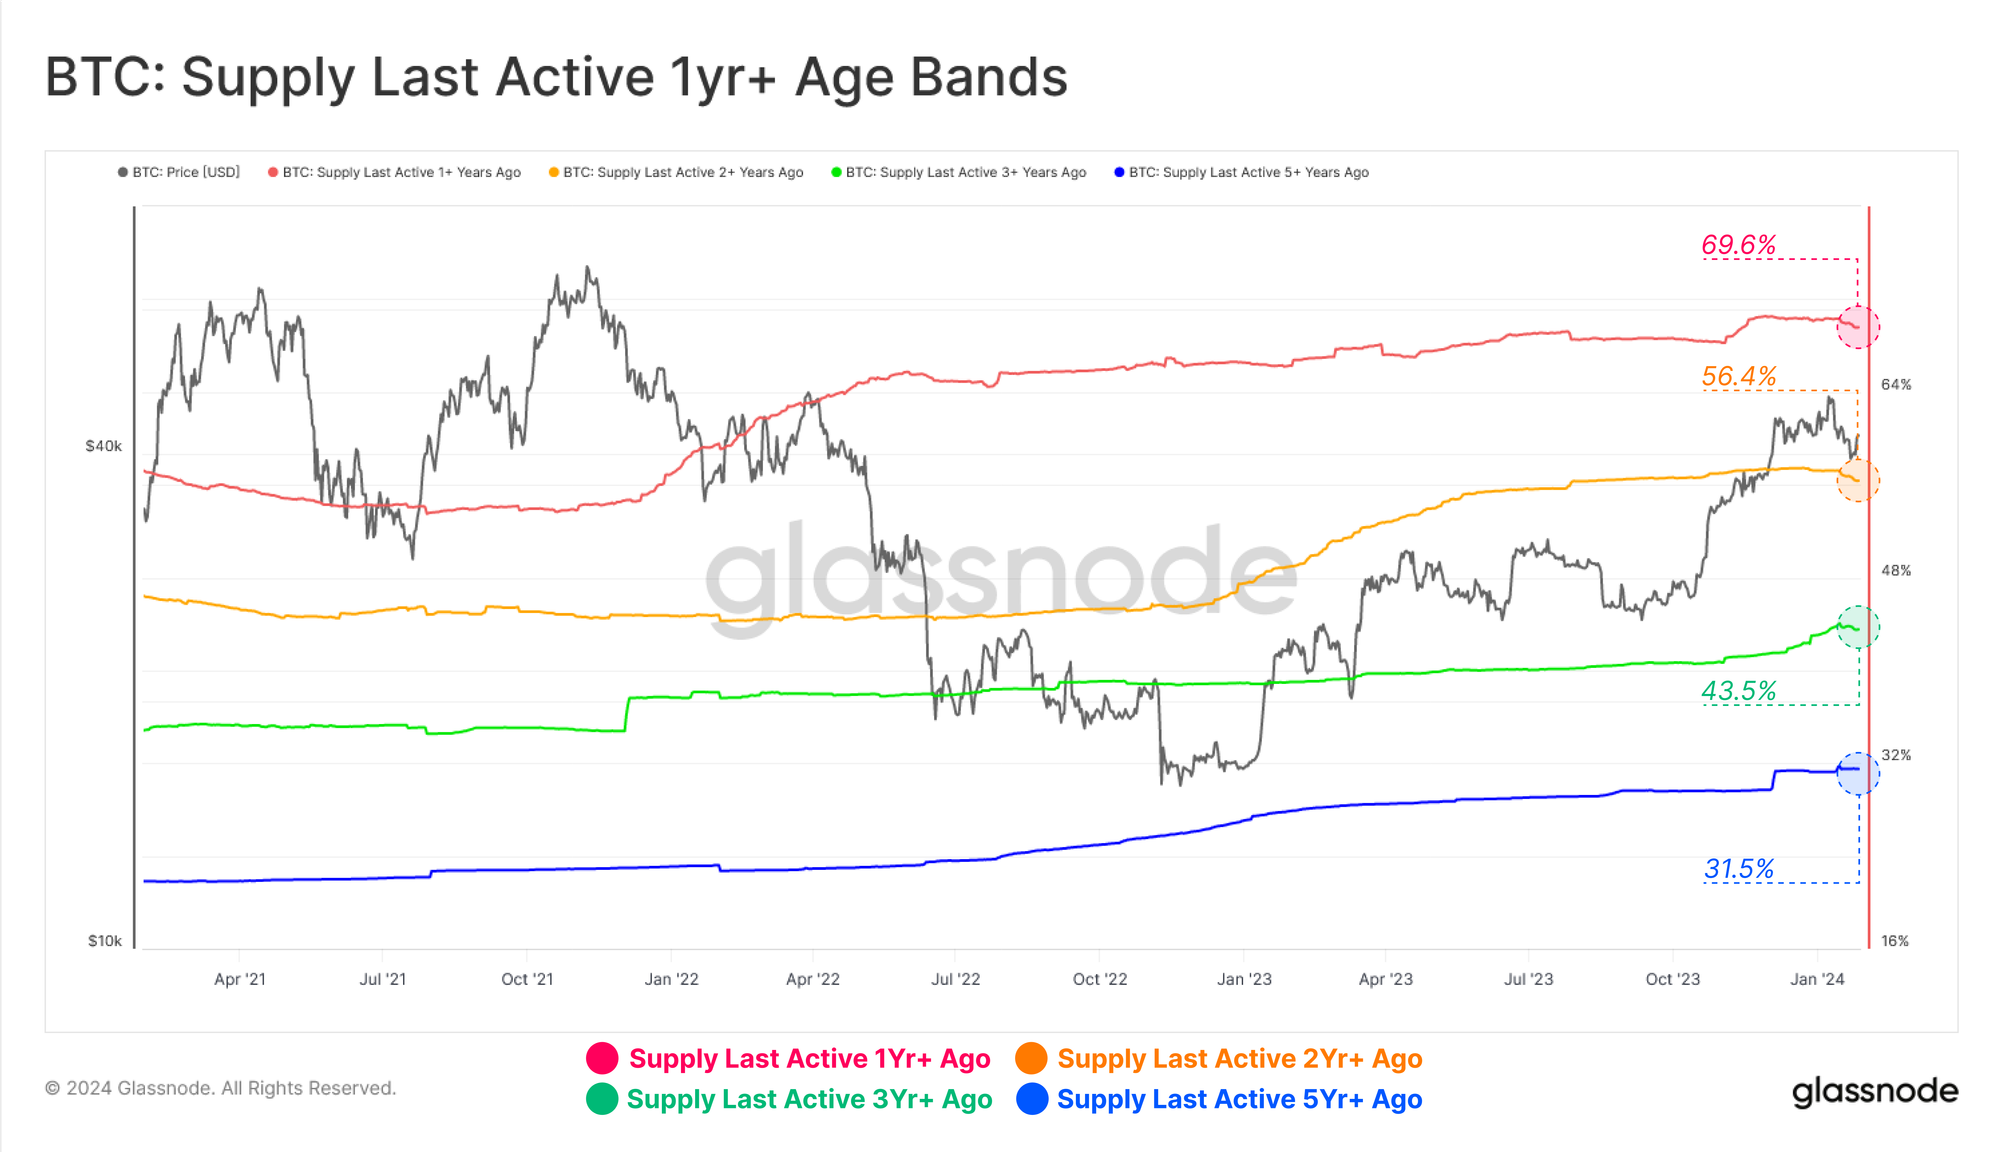
Amidst strong rallies, sell-the-news events, and dynamic markets, the vast majority of HODLers appear to be calmly riding the market waves. This set of Supply Last Active metrics measure the proportion of the circulating supply which has been held for multi-year time horizons.
We can see a slight downtick across the 1y and 2y bands specifically, with many, but not all being associated with GBTC. This indicates that a non-trivial volume of older supply has been on the move in recent weeks.
However, in absolute magnitude, the vast majority of the BTC holder base remains steadfast, with the percentage of held supply across multiple age bands residing just below ATHs:
🔴 1+ Years Ago: 69.9%
🟠 2+ Years Ago: 56.7%
🟢 3+ Years Ago: 43.8%
🔵 5+ Years Ago: 31.5%
In the WoC-46-2023, we introduced and compared several measures of “Stored Supply” and “Active Supply”. At the time, we noted a large divergence was in play between the two, with a significant dominance towards coins being dormant, inactive, and illiquid.
This year we see the first signs of a potential closing of this divergence, a notable increase across all measures of “Active Supply”. This provides confluence with the aforementioned uptick in older coin spending.

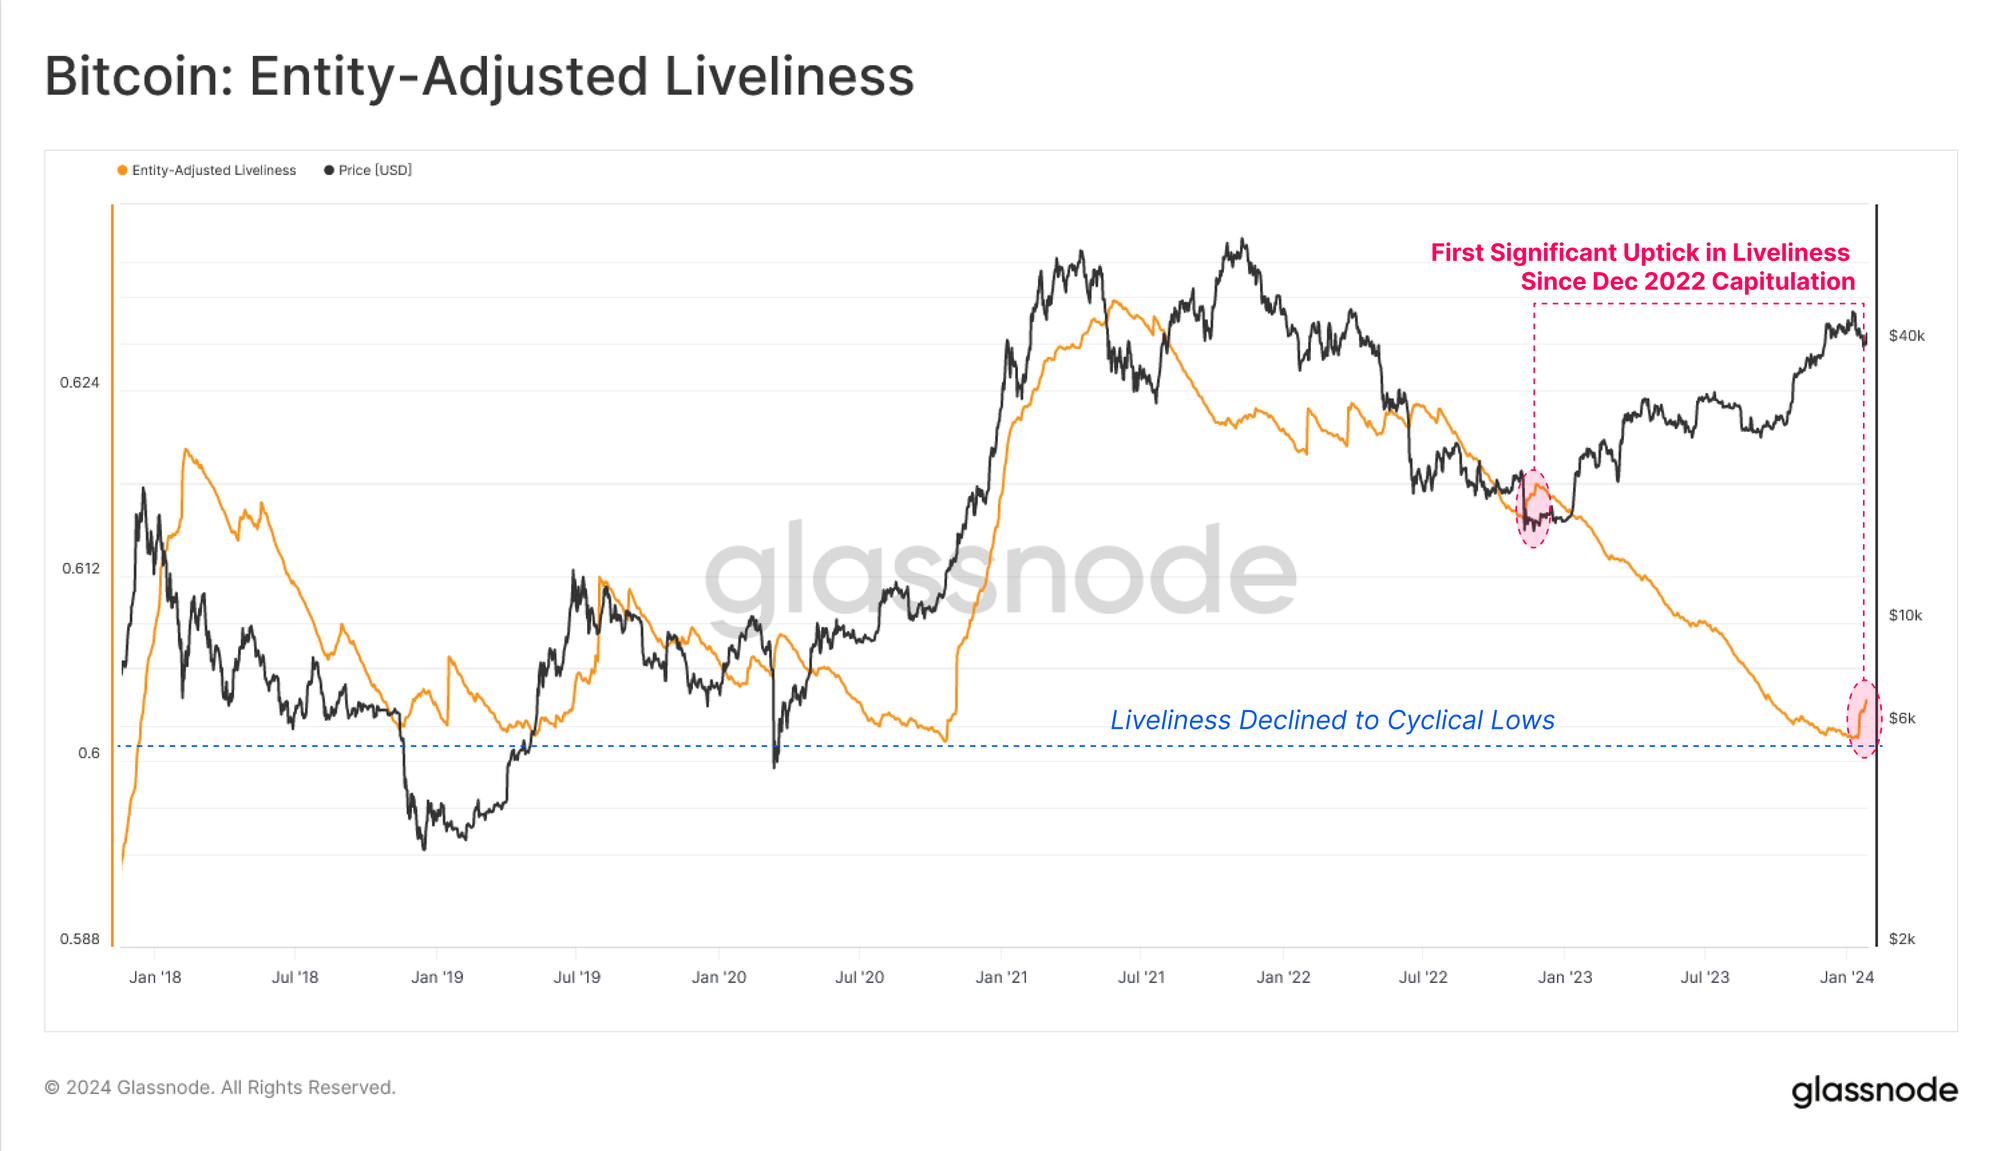
This has triggered the largest increase in liveliness since the Dec-2022 capitulation event. This again supports the above analysis, denoting an increase in Coinday Destruction as some investors part ways with a portion of their long-held coins.
However, when viewed in a macro context, Liveliness remains near multi-year lows, suggesting that the dominant majority of the supply remains tightly held, arguably waiting for higher spot prices, or perhaps increased volatility as a motivator to spend.
On-chain and Exchange Activity
Assessing on-chain activity for Bitcoin can provide great insights into the health, adoption, and growth of the network. However, despite strong price performance, a counter intuitive observation has emerged with the number of Active Entities declining to cycle lows of 219K per day.
At face value, this might suggest that despite the significant price appreciation, growth in Bitcoin users has not followed suit.
This is largely a result of the uptick in activity related to Ordinals and Inscriptions, where many participants are re-using Bitcoin addresses, and reducing the number of measured ‘active entities’ (does not double count).
💡

Transfer volumes on the other hand remains extremely robust with around $7.7B/day in economic volume processed. This divergence between ‘active entities’, and increasing transfer volumes highlights an elevated presence of large size entities active in the market, with the average Volume per Entity soaring to value of $26.3k/transaction.
This alludes to a growing presence of institutional investors and capital flows.

Exchanges, remain the primary venue for trading activity, and deposit and withdrawal volumes have experienced a significant expansion, hitting $6.8B/day. Exchange related deposit and withdrawal activity accounts for approximately 88% of all on-chain volume at present.
The current volume flowing in and out of exchanges rivals peaks set during the 2021 bull market, with only 68 trading days (1.5%) recording a higher value (30D-SMA basis).
This again underscores an expanding interest in Bitcoin from market participants.

Alongside increasing exchange flows, a regime of realized profit taking has followed suit. The chart below shows the average profit (or loss) per coin sent exchanges.
At the height of ETF speculation, this metric reached an average profit of $3.1k, a level reached at the peak of the April 2023 rally. This remains a far-cry from the $10.5k average profit at the zenith of the 2021 bull market, and is starting to cool off meaningfully.

Conclusion
The approval of nine spot Bitcoin ETFs is a landmark event for digital assets, with institutional flows now openly gravitating to the asset class. Capital inflows are now accelerating, despite the significant supply overhang as investors rebalance out of the long challenged GBTC ETF product.
Exchange flows on-chain have also reached values equivalent to the peak of the 2021 bull market, and the average size of value transferred is highting a growing presence of institutional and large capital investors.
Disclaimer: This report does not provide any investment advice. All data is provided for information and educational purposes only. No investment decision shall be based on the information provided here and you are solely responsible for your own investment decisions.
Exchange balances presented are derived from Glassnode’s comprehensive database of address labels, which are amassed through both officially published exchange information and proprietary clustering algorithms. While we strive to ensure the utmost accuracy in representing exchange balances, it is important to note that these figures might not always encapsulate the entirety of an exchange’s reserves, particularly when exchanges refrain from disclosing their official addresses. We urge users to exercise caution and discretion when utilizing these metrics. Glassnode shall not be held responsible for any discrepancies or potential inaccuracies. Please read our Transparency Notice when using exchange data.

- SEO Powered Content & PR Distribution. Get Amplified Today.
- PlatoData.Network Vertical Generative Ai. Empower Yourself. Access Here.
- PlatoAiStream. Web3 Intelligence. Knowledge Amplified. Access Here.
- PlatoESG. Carbon, CleanTech, Energy, Environment, Solar, Waste Management. Access Here.
- PlatoHealth. Biotech and Clinical Trials Intelligence. Access Here.
- Source: https://insights.glassnode.com/the-week-onchain-week-05-2024/
- :has
- :is
- :not
- :where
- $3
- 1
- 2%
- 20
- 2000
- 2013
- 2017
- 2021
- 2022
- 2023
- 28
- 31
- 43
- 45
- a
- above
- Absolute
- accelerate
- accelerating
- Accounts
- accuracy
- acquisition
- across
- active
- activity
- address
- addresses
- Adoption
- advice
- again
- age
- ago
- ahead
- algorithms
- All
- also
- always
- amassed
- an
- analysis
- Analysts
- and
- any
- appear
- appreciation
- approval
- approvals
- approximately
- April
- arbitrage
- ARE
- arguably
- argue
- around
- AS
- assess
- assesses
- asset
- asset class
- Assets
- associated
- At
- ATH
- AUGUST
- average
- average size
- balances
- base
- based
- basis
- BE
- Bear
- bear markets
- becomes
- been
- being
- below
- Better
- between
- Bitcoin
- bitcoin investors
- Bitcoin market
- bitcoin on-chain
- both
- bring
- BTC
- btc price
- bull
- Bull Market
- but
- by
- CAN
- cap
- capital
- capitulation
- caution
- challenged
- challenging
- Chart
- circulating
- class
- Close
- closed
- closing
- clustering
- Coin
- coinbase
- Coins
- compared
- comparison
- comprehensive
- conclusion
- confluence
- Consider
- consideration
- context
- Conversion
- Cool
- Corrections
- Cost
- cost basis
- count
- Counter
- Creating
- Current
- Currently
- cycle
- cycles
- data
- Database
- day
- Days
- decision
- decisions
- decisive
- Declining
- deeper
- Demand
- deposit
- Derived
- describing
- Despite
- detailed
- digital
- Digital Assets
- direct
- direct listing
- Disclosing
- Discount
- discretion
- Divergence
- does
- Dominance
- dominant
- double
- downside
- due
- duration
- during
- dynamic
- dynamics
- Early
- Economic
- educational
- eerily
- elevated
- emerged
- end
- ensure
- entirety
- entities
- entity
- Equivalent
- ETF
- ETFs
- Event
- events
- exchange
- Exchanges
- Exercise
- expanding
- expansion
- experienced
- experiencing
- extraordinary
- extremely
- Face
- far
- fee
- Figures
- First
- Flowing
- Flows
- followed
- following
- For
- from
- fund
- fundamental
- further
- GBTC
- Glassnode
- Grayscale
- great
- Growing
- Growth
- hand
- Have
- headwinds
- Health
- height
- heightened
- Held
- here
- High
- higher
- highlights
- history
- hitting
- Hodlers
- holder
- Horizons
- How
- However
- HTTPS
- important
- in
- inactive
- Increase
- increased
- increasing
- increasingly
- indicates
- inflows
- information
- insight
- insights
- instance
- Institutional
- institutional investors
- interest
- into
- introduced
- intuitive
- investment
- investor
- investor sentiment
- Investors
- IT
- ITS
- just
- Key
- Labels
- landmark
- large
- largely
- largest
- Last
- let
- Level
- levels
- like
- listing
- liveliness
- local
- Long
- long-term
- long-term bitcoin investors
- loss
- Low
- Lows
- Macro
- Majority
- manner
- many
- Market
- Markets
- mean
- measure
- measured
- measures
- Meets
- metric
- Metrics
- might
- model
- modest
- Momentum
- Monetary
- more
- move
- much
- multi-year
- multiple
- nav
- Near
- network
- New
- nine
- no
- notable
- note
- noted
- Notice..
- Notion
- now
- number
- observation
- of
- off
- official
- Officially
- often
- older
- on
- On-Chain
- on-chain activity
- only
- openly
- or
- Other
- our
- out
- outflows
- over
- own
- Pace
- part
- participants
- particularly
- Peak
- per
- percentage
- performance
- perhaps
- periods
- Place
- plato
- Plato Data Intelligence
- PlatoData
- Play
- portion
- potential
- Premium
- presence
- present
- presented
- previous
- price
- Prices
- primary
- Prior
- processed
- Product
- Profit
- pronounced
- proportion
- proprietary
- provide
- provided
- provides
- published
- purposes
- rallies
- rally
- reached
- Read
- realized
- rebalance
- recent
- recording
- Recover
- recovering
- recovery
- redemptions
- reducing
- reference
- regime
- related
- relatively
- remain
- remaining
- remains
- report
- representing
- resembles
- reserves
- resilience
- resilient
- responsible
- result
- riding
- rivals
- robust
- Said
- see
- seen
- sent
- sentiment
- set
- several
- severe
- severity
- shallow
- Shows
- significant
- Signs
- similar
- since
- Size
- soaring
- solely
- some
- somewhat
- sought
- specifically
- speculation
- spend
- Spending
- Spot
- spot etf
- Spot Prices
- Starting
- steadfast
- strive
- strong
- suggest
- Suit
- supply
- supply last active
- support
- Supports
- taking
- terms
- than
- that
- The
- The Coinbase
- the information
- their
- These
- this
- Through
- Thus
- tightly
- time
- to
- towards
- traded
- Traders
- trades
- Trading
- transfer
- transferred
- Transparency
- triggered
- true
- Trust
- two
- typical
- underscores
- users
- using
- Utilizing
- utmost
- value
- Values
- Vast
- Venue
- very
- viewed
- Volatility
- volume
- volumes
- Waiting
- was
- waves
- ways
- we
- Weeks
- WELL
- when
- which
- while
- with
- withdrawal
- would
- year
- years
- you
- Your
- Zenith
- zephyrnet