US:
- The Fed hiked by 25 bps as
expected and kept everything unchanged at the last meeting. - Fed Chair Powell reaffirmed their data dependency
and kept all the options on the table. - The US CPI
yesterday came in line with expectations, so the market’s pricing remained
roughly the same. - The labour market
displayed signs of softening although it remains fairly solid. - Last week the ISM Services PMI and Jobless Claims
surprised to the upside, which point to a resilient economy overall. - Yesterday, we got yet another beat in Jobless Claims followed
by strong Retail Sales and PPI data. - The Fed members are leaning more towards a pause in
September and the next decision will still be dictated by the economic data. - The market doesn’t expect the Fed to hike at the
September meeting and there’s just a 33% chance of a hike in November, although
that can change if the data keeps on running hot.
Canada:
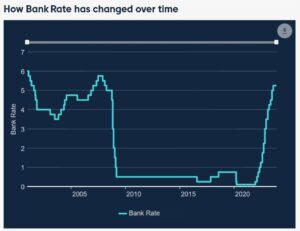
- The BoC left interest rates at 5.00% as expected but remains prepared to
raise rates further if needed. - BoC Governor Macklem delivered a hawkish speech which points to another rate hike
if the data remains strong into the next policy meeting. - The Canadian underlying inflation
data beat expectations on all measures for the June readings and recently we
got another beat for the July data. - On the labour market side, the recent
report showed another uptick in wage growth and this is something that Governor
Macklem said the BoC is watching carefully. - The market doesn’t expect the BoC to
hike again, but we still have lots of data before the next meeting.
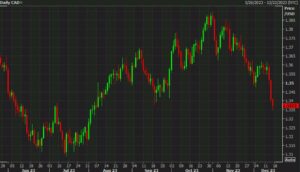
USDCAD Technical Analysis –
Daily Timeframe
USDCAD Daily
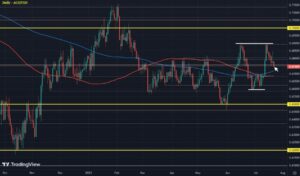
On the daily chart, we can see that USDCAD finally
pulled back all the way down to the key swing level at 1.3489 following another
uptick in the Canadian wage growth data. The moving averages have
crossed to the downside, so it might be an early sign that the trend is
changing, but the price has not made a new lower low, so the market structure
remains bullish.
USDCAD Technical Analysis –
4 hour Timeframe
USDCAD 4 hour
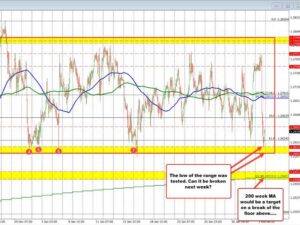
On the 4 hour chart, we can see that after the
massive divergence with the
MACD since
the beginning of August, we finally got a proper pullback. This swing level at
1.3489 is key because a break below it would switch the trend from bullish to
bearish and open the door for a fall into the 1.33 handle. In fact, we can
expect the buyers stepping in here with a defined risk below the swing level to
target a new high. The sellers, on the other hand, will want to see the price
breaking lower to pile in even more and target the 1.33 handle.
USDCAD Technical Analysis –
1 hour Timeframe
USDCAD 1 hour
On the 1 hour chart, we can see that we
have another divergence with the MACD right at the key swing level. This is
generally a sign of weakening momentum often followed by pullbacks or
reversals. In this case, we either get a pullback into the 1.3520 resistance where
we can also find the downward trendline or a
reversal in case the price breaks above the trendline. In the first scenario
the sellers are likely to lean on the resistance to position for a break below
the support with a tight risk above the trendline. In the second option, the
buyers are likely to pile in once the price breaks above the trendline and
target a new high.
Upcoming Events
Today the only notable
report left to be released for this week is the University of Michigan Consumer
sentiment survey. Consumer sentiment might have deteriorated given higher
energy prices and that might have filtered to higher inflation expectations.
- SEO Powered Content & PR Distribution. Get Amplified Today.
- PlatoData.Network Vertical Generative Ai. Empower Yourself. Access Here.
- PlatoAiStream. Web3 Intelligence. Knowledge Amplified. Access Here.
- PlatoESG. Automotive / EVs, Carbon, CleanTech, Energy, Environment, Solar, Waste Management. Access Here.
- PlatoHealth. Biotech and Clinical Trials Intelligence. Access Here.
- ChartPrime. Elevate your Trading Game with ChartPrime. Access Here.
- BlockOffsets. Modernizing Environmental Offset Ownership. Access Here.
- Source: https://www.forexlive.com/technical-analysis/usdcad-technical-analysis-the-pair-is-at-a-key-level-20230915/
- :has
- :is
- :not
- :where
- 1
- 25
- 33
- a
- above
- After
- again
- All
- also
- Although
- an
- analysis
- and
- Another
- ARE
- AS
- At
- AUGUST
- back
- BE
- bearish
- because
- before
- Beginning
- below
- BoC
- Break
- Breaking
- breaks
- Bullish
- but
- buyers
- by
- came
- CAN
- Canadian
- carefully
- case
- Chair
- Chance
- change
- changing
- Chart
- consumer
- consumer sentiment
- Crossed
- daily
- data
- decision
- defined
- delivered
- Dependency
- dictated
- displayed
- Divergence
- Doesn’t
- Door
- down
- downside
- downward
- Early
- Economic
- economy
- either
- energy
- energy prices
- Even
- everything
- expect
- expectations
- expected
- fact
- fairly
- Fall
- Fed
- Finally
- Find
- First
- followed
- following
- For
- from
- further
- generally
- get
- given
- got
- Governor
- Governor Macklem
- Growth
- hand
- handle
- Have
- here
- High
- higher
- Hike
- HOT
- hour
- HTTPS
- if
- in
- inflation
- Inflation expectations
- interest
- Interest Rates
- into
- IT
- jpg
- July
- june
- just
- kept
- Key
- Labour
- Last
- left
- Level
- likely
- Line
- Low
- lower
- MACD
- Macklem
- made
- Market
- Market Structure
- massive
- measures
- meeting
- Members
- Michigan
- might
- Momentum
- more
- needed
- New
- next
- notable
- November
- of
- often
- on
- once
- only
- open
- Option
- Options
- or
- Other
- overall
- pair
- pause
- plato
- Plato Data Intelligence
- PlatoData
- Point
- points
- policy
- position
- Powell
- prepared
- price
- Prices
- pricing
- proper
- pullback
- raise
- Rate
- Rate Hike
- Rates
- reaffirmed
- recent
- recently
- released
- remained
- remains
- report
- resilient
- Resistance
- Reversal
- right
- Risk
- roughly
- running
- Said
- same
- scenario
- Second
- see
- Sellers
- sentiment
- September
- Services
- showed
- side
- sign
- Signs
- since
- So
- solid
- something
- stepping
- Still
- strong
- structure
- support
- surprised
- Survey
- Swing
- Switch
- table
- Target
- Technical
- Technical Analysis
- that
- The
- the Fed
- their
- this
- this week
- to
- towards
- Trend
- underlying
- university
- University of Michigan
- Upside
- wage
- want
- watching
- Way..
- we
- week
- which
- will
- with
- would
- yesterday
- yet
- zephyrnet