- US stocks initially dropped on Thursday after US inflation came in higher than expected.
- Despite reduced odds of ratecuts, Treasury yields fell, propping up markets.
- Friday will close out the week with US PPI figures.
US equity indexes twisted on Thursday after US Consumer Price Index (CPI) inflation came in broadly above market expectations, sending equities lower and safe havens climbing in the early US trading session.
Market fears subsided and a decline in Treasury yields helped to bid equity indexes back into the day’s starting bids, keeping broad-market stock measures roughly on-balance as investors head into Friday’s US Producer Price Index (PPI) inflation print.
US CPI inflation climbs to 3.4% in December vs. 3.2% expected
US headline CPI inflation for the year ended December came in at 3.4% versus the market forecast of 3.2%, handily climbing over the previous period’s 3.1. December’s MoM CPI came in higher than expected at 0.3% versus the forecast 0.2%, and climbing further over November’s 0.1% print.
US Initial Jobless Claims for the week ended January 5 also came in better than expected, printing at 202K versus the anticipated 210K, though the previous week did see a slight upside revision to 203K (pre-revision 202K).
The US Producer Price Index (PPI) for December is expected to tick slightly higher from 0.0% to 0.1%, while annualized Core PPI for the year ended December is expected to clip lower from 2.0% to 1.9%.
US equity indexes are largely unchanged for Thursday, with the Standard & Poor’s (S&P) 500 major equity index ended Thursday down a scant 0.07%, sliding 3.2 points to end the day at $4,780.24. The Dow Jones Industrial Average (DJIA) closed at $37,711.02, up nearly 15.3 points and shaving into the green by 0.04%.
The NASDAQ Composite index ended Thursday almost perfectly flat at 0.0%, gaining half of a single point to close at $14,970.19, while the Russell 2000 index took a 0.75% hit to end the day at $14,970.19, down 14.8 points.
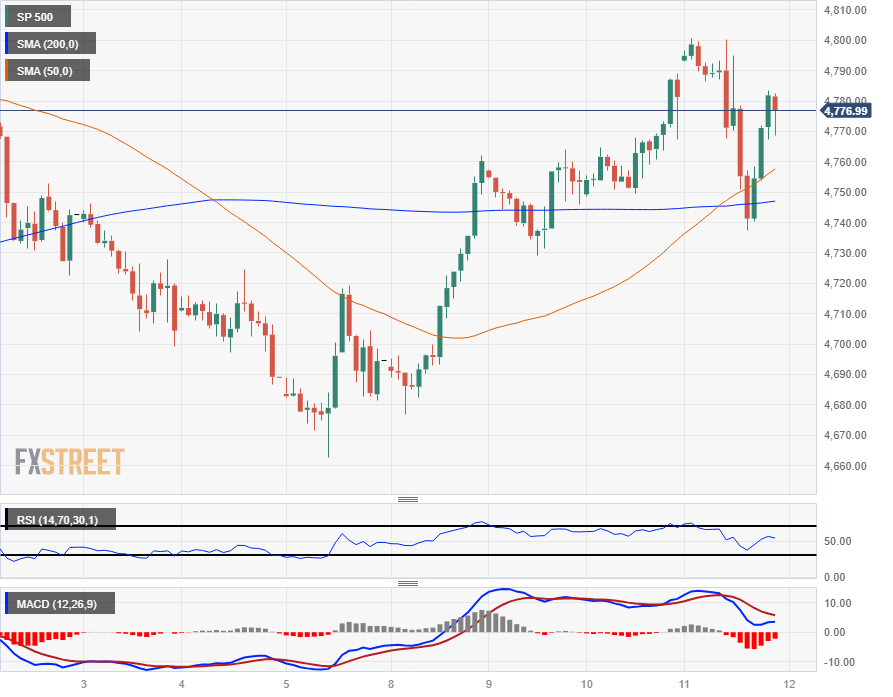
S&P 500 Technical Outlook
The S&P 500 major equity index declined from the day’s early high of $4,800.76 to an intraday low of $4,737.52 before rebounding to settle near $4,780.
Thursday’s swing lower caught a sharp technical rebound from the 200-hour Simple Moving Average (SMA) just below $4,750, chalking in a near-term technical floor.
Despite Thursday’s tests into the lower near-term bounds, the S&P 500 remains well-bid with the index holding steady near December’s late highs. The index sloughed off January’s early declines and equities are set for a continued rally into all-time highs beyond 2021’s late peak at $4,812.38.
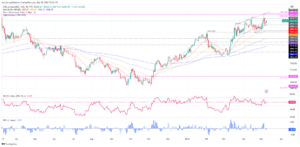
S&P 500 Hourly Chart
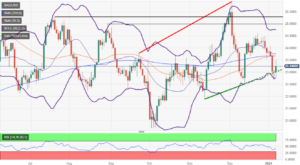
S&P 500 Daily Chart

S&P 500 Technical Levels
- SEO Powered Content & PR Distribution. Get Amplified Today.
- PlatoData.Network Vertical Generative Ai. Empower Yourself. Access Here.
- PlatoAiStream. Web3 Intelligence. Knowledge Amplified. Access Here.
- PlatoESG. Carbon, CleanTech, Energy, Environment, Solar, Waste Management. Access Here.
- PlatoHealth. Biotech and Clinical Trials Intelligence. Access Here.
- Source: https://www.fxstreet.com/news/us-equities-whip-after-us-cpi-inflation-grind-towards-the-middle-on-thursday-202401112351
- :is
- ][p
- $UP
- 1
- 14
- 15%
- 19
- 2%
- 2000
- 24
- 500
- 52
- 750
- 8
- 970
- a
- above
- After
- all-time highs
- almost
- also
- an
- and
- annualized
- Anticipated
- ARE
- AS
- At
- average
- back
- before
- below
- Better
- Beyond
- bid
- bounds
- broadly
- by
- came
- caught
- claims
- Climbing
- Close
- closed
- consumer
- continued
- Core
- CPI
- daily
- day
- December
- Decline
- Declines
- DID
- djia
- dow
- Dow Jones
- Dow Jones Industrial Average
- down
- dropped
- Early
- end
- ended
- Equities
- equity
- Ether (ETH)
- expectations
- expected
- fears
- Figures
- flat
- Floor
- For
- Forecast
- from
- further
- gaining
- Green
- Half
- head
- headline
- helped
- High
- higher
- Highs
- Hit
- holding
- HTTPS
- in
- index
- indexes
- industrial
- inflation
- initial
- initially
- into
- Investors
- January
- jobless claims
- jones
- just
- keeping
- largely
- Late
- Low
- lower
- major
- Market
- market forecast
- Markets
- measures
- Middle
- mom
- moving
- moving average
- Nasdaq
- Near
- nearly
- Odds
- of
- off
- on
- out
- over
- Peak
- perfectly
- plato
- Plato Data Intelligence
- PlatoData
- Point
- points
- ppi
- previous
- price
- printing
- producer
- rally
- rebound
- Reduced
- remains
- roughly
- S&P
- S&P 500
- safe
- see
- sending
- session
- set
- settle
- sharp
- Simple
- single
- sliding
- SMA
- standard
- Starting
- steady
- Stocks
- subsided
- Swing
- Technical
- tests
- than
- The
- though?
- thursday
- tick
- to
- took
- towards
- Trading
- treasury
- Treasury yields
- Upside
- us
- US CPI
- US Equities
- us inflation
- US PPI
- US Producer Price Index
- Versus
- vs
- week
- while
- will
- with
- year
- yields
- zephyrnet