- The DXY Index is bearing a slight uptick, lingering nearing three-month lows.
- US annualized Q3 GDP estimate was revised upward to 5.2%.
- Markets await October Core PCE inflation on Thursday.
The US Dollar (USD) Index (DXY) is seeing modest growth, trading at 102.85 on Wednesday. The DXY found traction due to robust revisions in Gross Domestic Product (GDP) figures for Q3 arriving before Thursday's Personal Consumption Expenditures (PCE) inflation data for October. The Greenback is also getting interest on the back of hawkish words from Federal Reserve’s (Fed) Thomas Barkin, who did not rule out another hike this cycle.
Despite the mixed labour market and cooling inflation, Fed officials aren't excluding the possibility of further policy tightening, thereby adopting a slightly hawkish stance. This seems to be an attempt to prevent any potential inflation slips and reflects the delicate balance the central bank is trying to maintain. That being said, it will come down to the incoming data, and Thursday’s PCE figures from October will have an impact on expectations for coming Fed decisions.
Daily Market Movers: US Dollar rises on strong GDP revisions and hawkish words from Thomas Barkin
- Amid optimism of a soft landing, the US Dollar trades with mild gains today. The driving factors are the revised Q3 GDP data.
- The GDP was revised to 5.2%, surpassing the consensus estimate of 5% and the previous estimate of 4.9%.
- Elsewhere, Thomas Barkin from the Fed stated that he is not confident that inflation is on track to reach the bank’s 2% target, and he didn’t rule out another rate hike.
- Meanwhile, US Treasury yields are currently dipping but trimmed some of the daily declines. The 2-year, 5-year and 10-year yields stand at 4.65%, 4.21% and 4.27%, respectively.
- Markets await Thursday’s Core PCE figures from October, the Fed’s preferred inflation gauge, which is expected to have decelerated to 3.5% YoY from 3.7% in September.
- Meanwhile, the CME FedWatch Tool suggests that the Fed won’t hike in the December meeting, and the markets are foreseeing rate cuts beginning in May 2024.
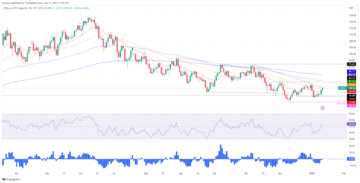
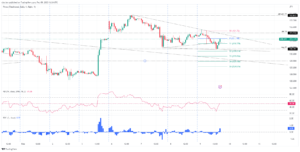
Technical Analysis: US Dollar under bearish pressure, RSI in oversold territory
Indicators on the daily chart are painting a bearish picture for the US Dollar. The Relative Strength Index (RSI) position suggests an overwhelming selling momentum standing flat at 30. Concurrently, the Moving Average Convergence Divergence (MACD) histogram displays a descending trajectory indicative of ongoing bearishness. The bear control is further affirmed by the currency's position in relation to the Simple Moving Averages (SMAs).
On a broader scale, the asset is trading beneath the 20, 100 and 200-day SMAs, underlining the prevailing strength of the bears. In this challenging scenario, buying momentum is noticeably struggling. These technical signals derived from the RSI, MACD and SMAs collectively point toward continued bearish dominance for the US Dollar in the immediate term.
Support levels: 102.50, 102.30, 102.00.
Resistance levels: 103.60 (200-day SMA), 104.00, 104.20 (100-day SMA)
US Dollar FAQs
The US Dollar (USD) is the official currency of the United States of America, and the ‘de facto’ currency of a significant number of other countries where it is found in circulation alongside local notes. It is the most heavily traded currency in the world, accounting for over 88% of all global foreign exchange turnover, or an average of $6.6 trillion in transactions per day, according to data from 2022.
Following the second world war, the USD took over from the British Pound as the world’s reserve currency. For most of its history, the US Dollar was backed by Gold, until the Bretton Woods Agreement in 1971 when the Gold Standard went away.
The most important single factor impacting on the value of the US Dollar is monetary policy, which is shaped by the Federal Reserve (Fed). The Fed has two mandates: to achieve price stability (control inflation) and foster full employment. Its primary tool to achieve these two goals is by adjusting interest rates.
When prices are rising too quickly and inflation is above the Fed’s 2% target, the Fed will raise rates, which helps the USD value. When inflation falls below 2% or the Unemployment Rate is too high, the Fed may lower interest rates, which weighs on the Greenback.
In extreme situations, the Federal Reserve can also print more Dollars and enact quantitative easing (QE). QE is the process by which the Fed substantially increases the flow of credit in a stuck financial system.
It is a non-standard policy measure used when credit has dried up because banks will not lend to each other (out of the fear of counterparty default). It is a last resort when simply lowering interest rates is unlikely to achieve the necessary result. It was the Fed’s weapon of choice to combat the credit crunch that occurred during the Great Financial Crisis in 2008. It involves the Fed printing more Dollars and using them to buy US government bonds predominantly from financial institutions. QE usually leads to a weaker US Dollar.
Quantitative tightening (QT) is the reverse process whereby the Federal Reserve stops buying bonds from financial institutions and does not reinvest the principal from the bonds it holds maturing in new purchases. It is usually positive for the US Dollar.
- SEO Powered Content & PR Distribution. Get Amplified Today.
- PlatoData.Network Vertical Generative Ai. Empower Yourself. Access Here.
- PlatoAiStream. Web3 Intelligence. Knowledge Amplified. Access Here.
- PlatoESG. Carbon, CleanTech, Energy, Environment, Solar, Waste Management. Access Here.
- PlatoHealth. Biotech and Clinical Trials Intelligence. Access Here.
- Source: https://www.fxstreet.com/news/us-dollar-trades-with-mild-gains-after-gdp-revisions-pce-inflation-data-202311291822
- :has
- :is
- :not
- :where
- $UP
- 100
- 102
- 2%
- 20
- 2008
- 2022
- 2024
- 29
- 30
- 31
- 35%
- 36
- 40
- 50
- 60
- a
- above
- According
- Accounting
- Achieve
- adjusting
- Adopting
- After
- Agreement
- All
- alongside
- also
- america
- an
- analysis
- and
- Animate
- annualized
- Another
- any
- ARE
- arriving
- AS
- asset
- At
- attempt
- average
- await
- away
- back
- backed
- Balance
- Bank
- Banks
- BE
- Bear
- bearish
- Bears
- because
- before
- Beginning
- being
- below
- bis
- Bonds
- Bretton
- Bretton Woods
- British
- British Pound
- broader
- but
- buy
- Buying
- by
- CAN
- central
- Central Bank
- challenging
- Chart
- choice
- Circulation
- CME
- collectively
- combat
- come
- coming
- confident
- Consensus
- consumption
- content
- continued
- control
- control inflation
- Convergence
- Core
- Counterparty
- countries
- credit
- crisis
- crunch
- Currency
- Currently
- cuts
- cycle
- daily
- data
- day
- December
- decisions
- Declines
- Default
- Derived
- DID
- displays
- Divergence
- does
- Dollar
- dollars
- Domestic
- Dominance
- down
- driving
- due
- during
- Dxy
- each
- easing
- employment
- ends
- estimate
- exchange
- excluding
- expanded
- expectations
- expected
- extreme
- factor
- factors
- Falls
- FAQ
- fear
- Fed
- Federal
- federal reserve
- Federal Reserve’s
- Figures
- financial
- financial crisis
- Financial institutions
- financial system
- flat
- flow
- For
- foreign
- foreign exchange
- foreseeing
- Foster
- found
- from
- full
- further
- Gains
- gauge
- GDP
- getting
- Global
- Goals
- Gold
- Gold Standard
- Government
- government bonds
- great
- Greenback
- gross
- Growth
- Have
- Hawkish
- he
- heavily
- helps
- High
- Hike
- history
- holds
- HTTPS
- immediate
- Impact
- impacting
- important
- in
- Incoming
- Increases
- index
- indicative
- inflation
- institutions
- interest
- Interest Rates
- involves
- IT
- ITS
- jpg
- Labour
- landing
- Last
- Leads
- LEND
- levels
- local
- lower
- lowering
- Lows
- MACD
- maintain
- mandates
- Market
- Markets
- May 2024
- May..
- measure
- meeting
- mild
- mixed
- modest
- module
- Momentum
- Monetary
- Monetary Policy
- more
- most
- Movers
- moving
- moving average
- moving averages
- nearing
- necessary
- New
- Notes
- noticeably
- number
- occurred
- october
- of
- official
- officials
- on
- ongoing
- Optimism
- or
- Other
- out
- over
- overwhelming
- painting
- pce
- per
- personal
- picture
- plato
- Plato Data Intelligence
- PlatoData
- Point
- policy
- position
- positive
- possibility
- potential
- pound
- predominantly
- preferred
- pressure
- prevent
- previous
- price
- Prices
- primary
- Principal
- printing
- process
- Product
- purchases
- Q3
- QE
- QT
- quantitative
- Quantitative Easing
- quickly
- raise
- Rate
- Rate Hike
- Rates
- reach
- reflects
- reinvest
- relation
- relative
- relative strength index
- Relative Strength Index (RSI)
- Reserve
- Reserve Currency
- reserves
- Resort
- respectively
- result
- reverse
- revisions
- Rises
- rising
- robust
- rsi
- Rule
- s
- Said
- Scale
- scenario
- Second
- Second world war
- seeing
- seems
- Selling
- September
- shaped
- signals
- significant
- Simple
- simply
- single
- situations
- SMA
- SMAs
- Soft
- some
- Stability
- stance
- stand
- standard
- standing
- starts
- stated
- States
- Stops
- strength
- strong
- Struggling
- substantially
- Suggests
- surpassing
- system
- T
- Target
- Technical
- term
- that
- The
- the Fed
- The United States of America
- the world
- Them
- thereby
- These
- this
- thursday
- tightening
- to
- today
- too
- took
- tool
- toward
- track
- traction
- traded
- trades
- Trading
- trajectory
- Transactions
- treasury
- Treasury yields
- Trillion
- trying
- turnover
- two
- under
- unemployment
- unemployment rate
- United
- United States
- UNITED STATES OF AMERICA
- unlikely
- until
- upward
- us
- US Dollar
- us government
- US Treasury
- US treasury yields
- USD
- USD value
- used
- using
- usually
- value
- war
- was
- Wednesday
- weighs
- went
- when
- which
- WHO
- will
- with
- Woods
- words
- world
- world’s
- yields
- zephyrnet