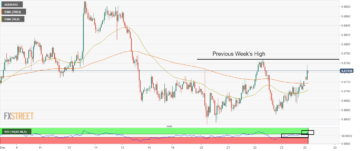
- DXY Index records a loss, unable to consolidate past 200-day SMA but closes a 0.20% winning week.
- Core PCE figures from December came in weak.
- Markets are still pushing the start of the Fed’s easing cycle to May.
The US Dollar (USD) Index is presently grappling with losses, trading at 103.35 on the DXY, in response to the release of softer Personal Consumption Expenditures (PCE) data for December, which gave the doves hope of earlier rate cuts.
In that sense, market expectations hint at a possible rate cut by the Fed in March. However, if economic growth sustains itself, a March rate cut seems unlikely. This is why bets have continued to shift toward the easing cycle beginning in May. In case the US continues to show resilience and markets delay expectations of the cuts, the downside is limited for the short term.
Daily Digest Market Movers: US Dollar declines after December PCE data
- The December Core PCE Price Index (YoY), the Fed’s preferred gauge of inflation, came in at 2.9%, slightly under the consensus of 3% and a decrease from the previous 3.2%.
- The headline index remained constant at 2.6% as anticipated.
- The 2-year, 5-year and 10-year US bond yields are on the rise, currently trading at 4.35%, 4.04% and 4.14%, respectively.
- The CME FedWatch Tool indicates that no changes in hike rates are expected for the January meeting, while markets are hinting at rate cuts in March and May 2024 with higher odds for the easing cycle to start in the latter.
Technical Analysis: DXY Index short-term buying pressure wanes as bulls struggle to defend the 200-day SMA
The indicators on the daily chart reflect a tussle between buying and selling pressure. The Relative Strength Index (RSI) showcases a negative slope yet remains in positive territory, hinting toward diminishing buying momentum. Thus, a potential shift toward sellers might be on the cards.
In unison, the Moving Average Convergence Divergence (MACD) indicator is also signaling a decline in upward pressure as the green bars on the histogram have started to decrease.
On observing the position of the index relative to its Simple Moving Averages (SMAs), we notice a mix of buying and selling pressure. The DXY holding above the 20-day SMA suggests attempts by bulls to control the short-term market trend, even as lingering bearish undertones persist.
The fact that the index is still below the 100 and 200-day SMAs, however, indicates that bears are maintaining a bullish grip on the broader context. The sellers seem to be dominating the narrative in the longer run, with the bulls struggling to gain ground.
Support Levels: 103.30, 103.00, 102.80, 102.60 (20-day SMA).
Resistance Levels: 103.50 (200-day SMA), 103.70, 103.90.
Interest rates FAQs
Interest rates are charged by financial institutions on loans to borrowers and are paid as interest to savers and depositors. They are influenced by base lending rates, which are set by central banks in response to changes in the economy. Central banks normally have a mandate to ensure price stability, which in most cases means targeting a core inflation rate of around 2%.
If inflation falls below target the central bank may cut base lending rates, with a view to stimulating lending and boosting the economy. If inflation rises substantially above 2% it normally results in the central bank raising base lending rates in an attempt to lower inflation.
Higher interest rates generally help strengthen a country’s currency as they make it a more attractive place for global investors to park their money.
Higher interest rates overall weigh on the price of Gold because they increase the opportunity cost of holding Gold instead of investing in an interest-bearing asset or placing cash in the bank.
If interest rates are high that usually pushes up the price of the US Dollar (USD), and since Gold is priced in Dollars, this has the effect of lowering the price of Gold.
The Fed funds rate is the overnight rate at which US banks lend to each other. It is the oft-quoted headline rate set by the Federal Reserve at its FOMC meetings. It is set as a range, for example 4.75%-5.00%, though the upper limit (in that case 5.00%) is the quoted figure.
Market expectations for future Fed funds rate are tracked by the CME FedWatch tool, which shapes how many financial markets behave in anticipation of future Federal Reserve monetary policy decisions.
- SEO Powered Content & PR Distribution. Get Amplified Today.
- PlatoData.Network Vertical Generative Ai. Empower Yourself. Access Here.
- PlatoAiStream. Web3 Intelligence. Knowledge Amplified. Access Here.
- PlatoESG. Carbon, CleanTech, Energy, Environment, Solar, Waste Management. Access Here.
- PlatoHealth. Biotech and Clinical Trials Intelligence. Access Here.
- Source: https://www.fxstreet.com/news/us-dollar-trades-at-loss-following-the-release-of-decembers-pce-data-202401261804
- :has
- :is
- $UP
- 100
- 102
- 2%
- 2024
- 28
- 30
- 32
- 33
- 35%
- 50
- 60
- 70
- 80
- 90
- a
- above
- After
- ahead
- also
- an
- analysis
- and
- Animate
- Anticipated
- anticipation
- ARE
- around
- AS
- asset
- At
- attempt
- Attempts
- attractive
- average
- Bank
- Banks
- bars
- base
- BE
- bearish
- Bears
- because
- Beginning
- below
- Bets
- between
- bond
- Bond yields
- boosting
- borrowers
- broader
- Bullish
- Bulls
- but
- Buying
- by
- came
- Cards
- case
- cases
- Cash
- central
- Central Bank
- Central Banks
- Changes
- charged
- Closes
- CME
- Consensus
- consolidate
- constant
- consumption
- content
- context
- continued
- continues
- control
- Convergence
- Core
- core inflation
- Cost
- country’s
- Currency
- Currently
- Cut
- cuts
- cycle
- daily
- data
- December
- decisions
- Decline
- Declines
- decrease
- delay
- depositors
- Digest
- diminishing
- Divergence
- Dollar
- dollars
- dominating
- downside
- Dxy
- each
- Earlier
- easing
- Economic
- Economic growth
- economy
- effect
- ends
- ensure
- Even
- example
- expanded
- expectations
- expected
- fact
- Falls
- FAQ
- Fed
- fed funds rate
- Federal
- federal reserve
- Figure
- Figures
- financial
- Financial institutions
- FOMC
- For
- from
- funds
- future
- Gain
- gauge
- gave
- generally
- Global
- Gold
- grappling
- Green
- Ground
- Growth
- Have
- headline
- help
- High
- higher
- Hike
- holding
- hope
- How
- However
- HTTPS
- if
- in
- Increase
- index
- indicates
- Indicator
- inflation
- inflation rate
- influenced
- instead
- institutions
- interest
- Interest Rates
- investing
- Investors
- IT
- ITS
- itself
- January
- jpg
- LEND
- lending
- levels
- LIMIT
- Limited
- Loans
- longer
- loss
- losses
- lower
- lowering
- MACD
- maintaining
- make
- mandate
- many
- March
- Market
- Markets
- May 2024
- May..
- means
- meeting
- meetings
- might
- mix
- module
- Momentum
- Monetary
- Monetary Policy
- money
- more
- most
- Movers
- moving
- moving average
- moving averages
- NARRATIVE
- negative
- no
- normally
- Notice..
- Odds
- of
- on
- Opportunity
- or
- Other
- overall
- overnight
- paid
- Park
- past
- pce
- personal
- Place
- placing
- plato
- Plato Data Intelligence
- PlatoData
- policy
- position
- positive
- possible
- potential
- preferred
- presently
- pressure
- previous
- price
- pushes
- Pushing
- raising
- range
- Rate
- Rates
- records
- reflect
- relative
- relative strength index
- Relative Strength Index (RSI)
- release
- remained
- remains
- Reserve
- resilience
- respectively
- response
- Results
- Rise
- Rises
- rsi
- Run
- Savers
- seem
- seems
- Sellers
- Selling
- sense
- set
- shapes
- shift
- Short
- short-term
- show
- Simple
- since
- Slope
- SMA
- SMAs
- Stability
- start
- started
- starts
- Still
- strength
- Strengthen
- Struggle
- Struggling
- substantially
- Suggests
- Target
- targeting
- term
- territory
- that
- The
- the Fed
- their
- they
- this
- though?
- Thus
- to
- tool
- toward
- Trading
- Trend
- unable
- under
- unison
- unlikely
- upward
- us
- US banks
- US bond yields
- US Dollar
- USD
- usually
- View
- we
- week
- Week ahead
- weigh
- which
- while
- why
- winning
- with
- yet
- yields
- zephyrnet