- Stellar lumen price is attempting a fresh increase from the $0.14 zone against the US Dollar.
- XLM price is now trading above $0.150 and the 55 simple moving average (4 hours).
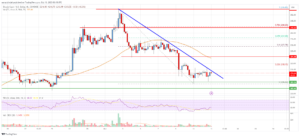
- There was a break above a major bearish trend line with resistance near $0.145 on the 4-hour chart (data feed via Kraken).
- The pair could start a major increase if there is a clear move above the $0.1650 resistance zone.
Stellar lumen price is trading above $0.150 against the US Dollar, similar to Bitcoin. XLM price must clear $0.1650 to start a fresh increase.
Stellar Lumen Price Analysis (XLM to USD)
After a steady increase, Stellar lumen price saw a downside correction below the $0.180 level against the US Dollar. The XLM/USD pair traded below the $0.165 support and tested the $0.140 zone.
A low is formed near $0.1404 and the price is now attempting a recovery wave. There was a break above the $0.145 resistance zone. Besides, there was a break above a major bearish trend line with resistance near $0.145 on the 4-hour chart.
The price climbed above the 50% Fib retracement level of the downward move from the $0.1807 swing high to the $0.1404 low. XLM is now trading above $0.150 and the 55 simple moving average (4 hours).
On the upside, the price is facing resistance near the $0.165 zone. It is close to the 61.8% Fib retracement level of the downward move from the $0.1807 swing high to the $0.1404 low. The next major resistance is near the $0.180 level.
A clear move above the $0.180 level might send the price toward the $0.192 level. Any more gains could lead the price toward the $0.200 level or even $0.2150.
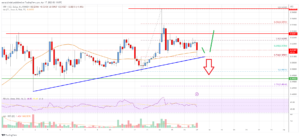
Initial support on the downside is near the $0.1520 level. The main support is near the $0.140 zone. Any more losses could lead the price toward the $0.1250 level in the near term, below which the price might even retest $0.1120.

The chart indicates that XLM price is now trading above $0.150 and the 55 simple moving average (4 hours). Overall, the price could start a major increase if there is a clear move above the $0.1650 resistance zone.
Technical Indicators
4 hours MACD – The MACD for XLM/USD is losing momentum in the bullish zone.
4 hours RSI – The RSI for XLM/USD is now near the 50 level.
Key Support Levels – $0.1520 and $0.1400.
Key Resistance Levels – $0.165, $0.180, and $0.200.
- SEO Powered Content & PR Distribution. Get Amplified Today.
- PlatoData.Network Vertical Generative Ai. Empower Yourself. Access Here.
- PlatoAiStream. Web3 Intelligence. Knowledge Amplified. Access Here.
- PlatoESG. Automotive / EVs, Carbon, CleanTech, Energy, Environment, Solar, Waste Management. Access Here.
- BlockOffsets. Modernizing Environmental Offset Ownership. Access Here.
- Source: https://www.livebitcoinnews.com/stellar-lumen-xlm-price-aims-fresh-increase-to-0-18/
- :is
- 14
- 180
- 200
- 50
- a
- above
- against
- aims
- analysis
- and
- any
- attempting
- average
- bearish
- below
- besides
- Bitcoin
- Bitcoin News
- Break
- Bullish
- Chart
- clear
- Climbed
- Close
- could
- data
- Dollar
- downside
- downward
- Even
- facing
- For
- formed
- fresh
- fresh increase
- from
- Gains
- High
- HOURS
- HTTPS
- if
- in
- Increase
- indicates
- IT
- Kraken
- lead
- Level
- levels
- Line
- live
- Live Bitcoin News
- losing
- losses
- Low
- Lumen
- MACD
- Main
- major
- max-width
- might
- Momentum
- more
- move
- moving
- moving average
- must
- Near
- news
- next
- now
- of
- on
- or
- overall
- pair
- plato
- Plato Data Intelligence
- PlatoData
- price
- Price Analysis
- recovery
- Resistance
- retracement
- rsi
- saw
- send
- similar
- Simple
- start
- steady
- Stellar
- Stellar Lumen
- support
- support levels
- Swing
- term
- tested
- that
- The
- There.
- to
- toward
- traded
- Trading
- TradingView
- Trend
- Upside
- us
- US Dollar
- USD
- via
- was
- Wave
- which
- with
- XLM
- xlm price
- XLM/USD
- zephyrnet