- Ripple price started a downside correction from the $0.5500 zone against the US dollar.
- The price is now trading above $0.505 and the 55 simple moving average (4 hours).
- There is a key bullish trend line forming with support near $0.5090 on the 4-hour chart of the XRP/USD pair (data source from Kraken).
- The pair could start a fresh increase above the $0.5200 resistance.
Ripple price is consolidating near $0.510 against the US Dollar, similar to Bitcoin. XRP price must stay above the $0.500 support to remain in a bullish zone.
Ripple Price Analysis
This past week, Ripple price saw a strong increase above the $0.5120 resistance against the US Dollar. The XRP/USD pair climbed above the $0.525 resistance to move into a positive zone.
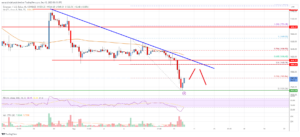
There was a steady increase and the price climbed toward the $0.535 resistance. A high was formed near $0.5476 and the price recently corrected lower. There was a move below the $0.535 and $0.520 levels. The bears pushed the price below the 50% Fib retracement level of the upward move from the $0.4981 swing low to the $0.5476 high.
The price is now trading above $0.505 and the 55 simple moving average (4 hours). It is trading above the 76.4% Fib retracement level of the upward move from the $0.4981 swing low to the $0.5476 high.
There is also a key bullish trend line forming with support near $0.5090 on the 4-hour chart of the XRP/USD pair. On the upside, the price is facing resistance near $0.5200.
The next major resistance is near the $0.5280 level. A close above the $0.5280 resistance zone might start a strong increase. In the stated case, the price could even surpass the $0.5500 resistance. Any more gains might send the price toward the $0.580 resistance.
Initial support on the downside is near the $0.5090 level. The next major support is near the $0.5000 level. Any more losses could lead the price toward the $0.492 level, below which the price might even test $0.465.

Ripple Price
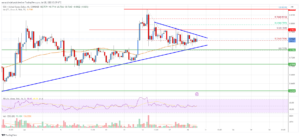
Looking at the chart, Ripple’s price is now trading above the $0.505 zone and the 55 simple moving average (4 hours). Overall, the price could start a major increase above the $0.5200 resistance.
Technical indicators
4 hours MACD – The MACD for XRP/USD is now gaining momentum in the bearish zone.
4 hours RSI (Relative Strength Index) – The RSI for XRP/USD is near the 50 level.
Key Support Levels – $0.5090, $0.5000, and $0.492.
Key Resistance Levels – $0.5200 and $0.5280.
- SEO Powered Content & PR Distribution. Get Amplified Today.
- Platoblockchain. Web3 Metaverse Intelligence. Knowledge Amplified. Access Here.
- Minting the Future w Adryenn Ashley. Access Here.
- Source: https://www.livebitcoinnews.com/ripple-price-analysis-dips-likely-to-be-supported-above-0-5/
- :is
- a
- above
- against
- analysis
- and
- At
- average
- BE
- bearish
- Bears
- below
- Bullish
- case
- Chart
- Climbed
- Close
- comments
- consolidating
- corrected
- could
- data
- Dollar
- downside
- Even
- facing
- follow
- For
- formed
- fresh
- fresh increase
- from
- gaining
- Gains
- High
- HOURS
- HTTPS
- in
- Increase
- index
- internal
- IT
- Key
- Kraken
- lead
- Level
- levels
- likely
- Line
- losses
- Low
- MACD
- major
- might
- Momentum
- more
- move
- moving
- moving average
- Near
- next
- of
- on
- overall
- past
- plato
- Plato Data Intelligence
- PlatoData
- positive
- Post
- price
- Price Analysis
- pushed
- recently
- relative strength index
- remain
- Resistance
- retracement
- Ripple
- ripple price
- Ripple Price Analysis
- rsi
- similar
- Simple
- Source
- start
- started
- stated
- stay
- steady
- strength
- strong
- support
- support levels
- Supported
- surpass
- Swing
- TAG
- test
- The
- to
- toward
- Trading
- TradingView
- Trend
- Upside
- upward
- us
- US Dollar
- week
- which
- with
- xrp
- XRP Price
- XRP/USD
- zephyrnet