- The US major equity index is inches away from new all-time highs.
- A late-day pullback sparked by rising Treasury yields pushed assets lower.
- 2023 set for deja vu with the S&P challenging familiar peak levels.
The Standard & Poor’s 500 (S&P) large-cap equity index came within ten points of posting new all-time highs on Friday before getting dragged back after a surprise bump in Treasury yields following a 7-year T-note auction that splashed water on the market’s ongoing risk rally fueled by rate cut expectations in 2024.
US 7-year Treasury yields rose from 3.837% to 3.859% on Thursday in a $40 billion bond auction, sparking a reversal of the week’s risk appetite flows. Risk bids were extended by misses in US economic data early Thursday, with US Initial Jobless Claims and Pending Home Sales both missing the mark.
Forex Today: Santa’s rally continues, Dollar rebounds
US Initial Jobless Claims for the week ended December 22 also ticked higher, showing 218K new jobless benefits seekers versus the previous week’s 206K (revised from 205K). US Pending Home Sales in November also flubbed market expectations, coming in flat at 0.0% and missing the market’s forecast 1.0% rebound from October’s -1.2% decline (revised upwards from -1.5%).
Money markets continue to pin their hopes and dreams on an accelerated pace of rate cuts from the Federal Reserve (Fed) in 2024, with investors betting on rate cuts to start as soon as March and pegging upwards of 160 basis points in rate cuts through the end of next year.
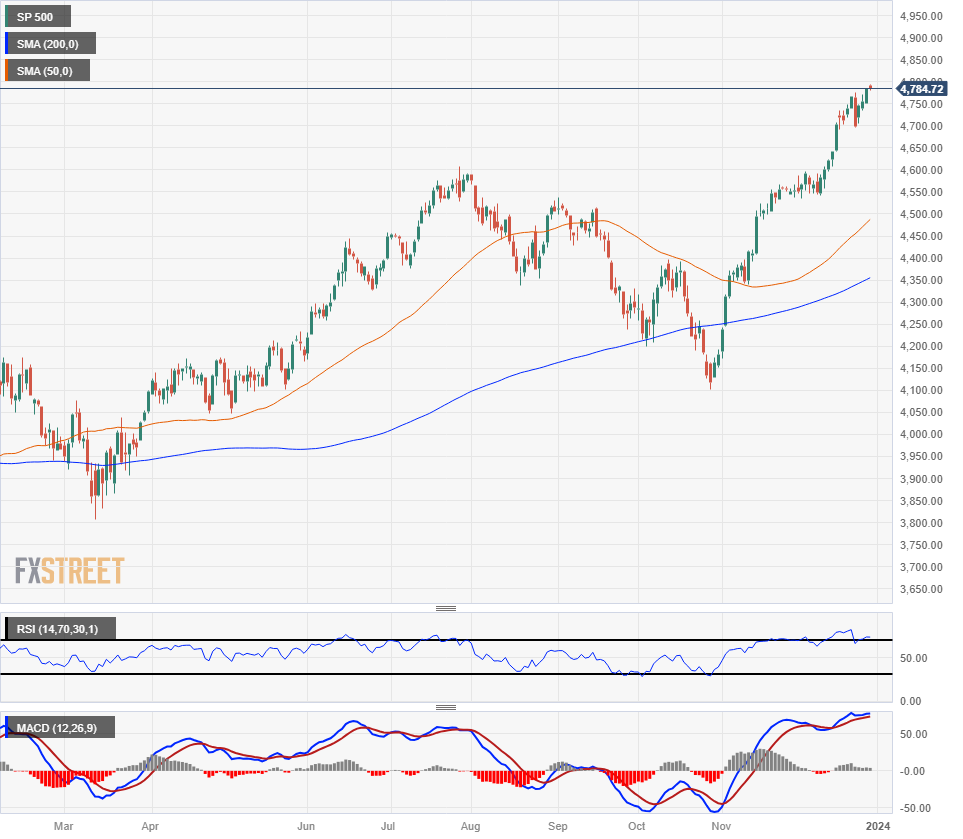
S&P 500 Technical Outlook
The S&P 500 is set for a ninth straight week of gains as the equity index climbs towards all-time highs with the ceiling at $4,814.68, set in January of 2021 with markets set to repeat the pattern of setting a technical record at the outset of a new trading year.
The S&P 500 has been on the rise since rebounding from the 200-day Simple Moving Average (SMA) near $4,250 in early November. Crossing the $4,800 handle sets the index up to clear all-time highs, while a pullback from extremely oversold conditions sets the index up for an extended decline into the last swing low at $4,100 from late October.
S&P 500 Daily Chart
S&P 500 Technical Levels
- SEO Powered Content & PR Distribution. Get Amplified Today.
- PlatoData.Network Vertical Generative Ai. Empower Yourself. Access Here.
- PlatoAiStream. Web3 Intelligence. Knowledge Amplified. Access Here.
- PlatoESG. Carbon, CleanTech, Energy, Environment, Solar, Waste Management. Access Here.
- PlatoHealth. Biotech and Clinical Trials Intelligence. Access Here.
- Source: https://www.fxstreet.com/news/sp-500-ends-thursday-within-ten-points-of-all-time-highs-near-4-800-202312282246
- :has
- :is
- ][p
- $UP
- 1
- 100
- 160
- 2%
- 2021
- 2024
- 22
- 250
- 500
- a
- accelerated
- After
- all-time highs
- also
- an
- and
- AS
- Assets
- At
- Auction
- average
- away
- back
- basis
- been
- before
- benefits
- Betting
- Billion
- bond
- both
- by
- came
- ceiling
- challenging
- claims
- clear
- coming
- conditions
- continue
- continues
- crossing
- Cut
- cuts
- daily
- data
- December
- Decline
- Dollar
- dreams
- Early
- Economic
- end
- ended
- ends
- equity
- Ether (ETH)
- expectations
- extended
- extremely
- extremely oversold conditions
- familiar
- Fed
- Federal
- federal reserve
- flat
- Flows
- following
- For
- Friday
- from
- fueled
- Gains
- getting
- handle
- higher
- Highs
- Home
- hopes
- HTTPS
- in
- inches
- index
- initial
- into
- Investors
- January
- jobless claims
- Last
- Late
- levels
- Low
- lower
- major
- March
- mark
- Market
- Markets
- misses
- missing
- moving
- moving average
- Near
- New
- next
- November
- october
- of
- on
- ongoing
- Pace
- Pattern
- Peak
- pending
- plato
- Plato Data Intelligence
- PlatoData
- points
- previous
- pullback
- pushed
- rally
- Rate
- rebound
- record
- repeat
- Reserve
- Reversal
- Rise
- rising
- Risk
- ROSE
- S&P
- S&P 500
- sales
- set
- Sets
- setting
- showing
- Simple
- since
- SMA
- Soon
- sparked
- standard
- start
- straight
- surprise
- Swing
- Technical
- ten
- that
- The
- their
- Through
- thursday
- to
- today
- towards
- Trading
- treasury
- Treasury yields
- upwards
- us
- US Initial Jobless Claims
- Versus
- Water
- week
- were
- while
- with
- within
- year
- yields
- zephyrnet
![Emini S&P faces resistance at 4200/4210 amidst sideways trend [Video]](https://platoaistream.com/wp-content/uploads/2023/04/emini-sp-faces-resistance-at-4200-4210-amidst-sideways-trend-video-300x200.jpg)