- The XAG/USD jumped above $22.70, seeing more than 0.80% gains and is set to close a winning week.
- Core PCE declined to 4.6% YoY in May, lower than expectations.
- Following the data the USD and US bond yields retreated.
The XAG/USD surpassed the $22.70 mark on Friday and registered an increase of over 0.80%. This positive momentum positions it for a week of gains after two weeks of losses. The boost in Silver prices can be explained by the release of soft Core Personal Consumption Expenditures (PCE) data from the US from May, which revealed a decline to 4.6% year-on-year in May, falling short of expectations. As a result, the US dollar and US bond yields retreated in response to the data favoring the precious metal.
USD weakened after soft Core PCE figures
The US's Core Personal Consumption Expenditures (PCE), which measures the amount of money consumers spend in a month excluding seasonally volatile products such as food and energy, witnessed a decline in May. The figure decelerated from 4.7% to 4.6% YoY in May, while the headline dropped from 4.6% to 3.8%.
As a reaction, the DXY Index dropped from 103.55 to 102.90 while US bond yields which could be considered the opportunity cost of holding non-yielding precious metals retreated from daily highs. In that sense, the yield on the 2-year Treasury Bond reached a peak of 4.93%, marking its highest level since March 9 and subsequently pulled back to 4.85%. In addition, the 5-year and 10-year rates experienced declines, with the former falling to 4.13% and the latter dropping to 3.83%.
Focus now shifts to next week’s labor market data from the US, including ADP, Jobless Claims on Thursday, and the Nonfarm Payrolls report on Friday.
XAG/USD Levels to watch
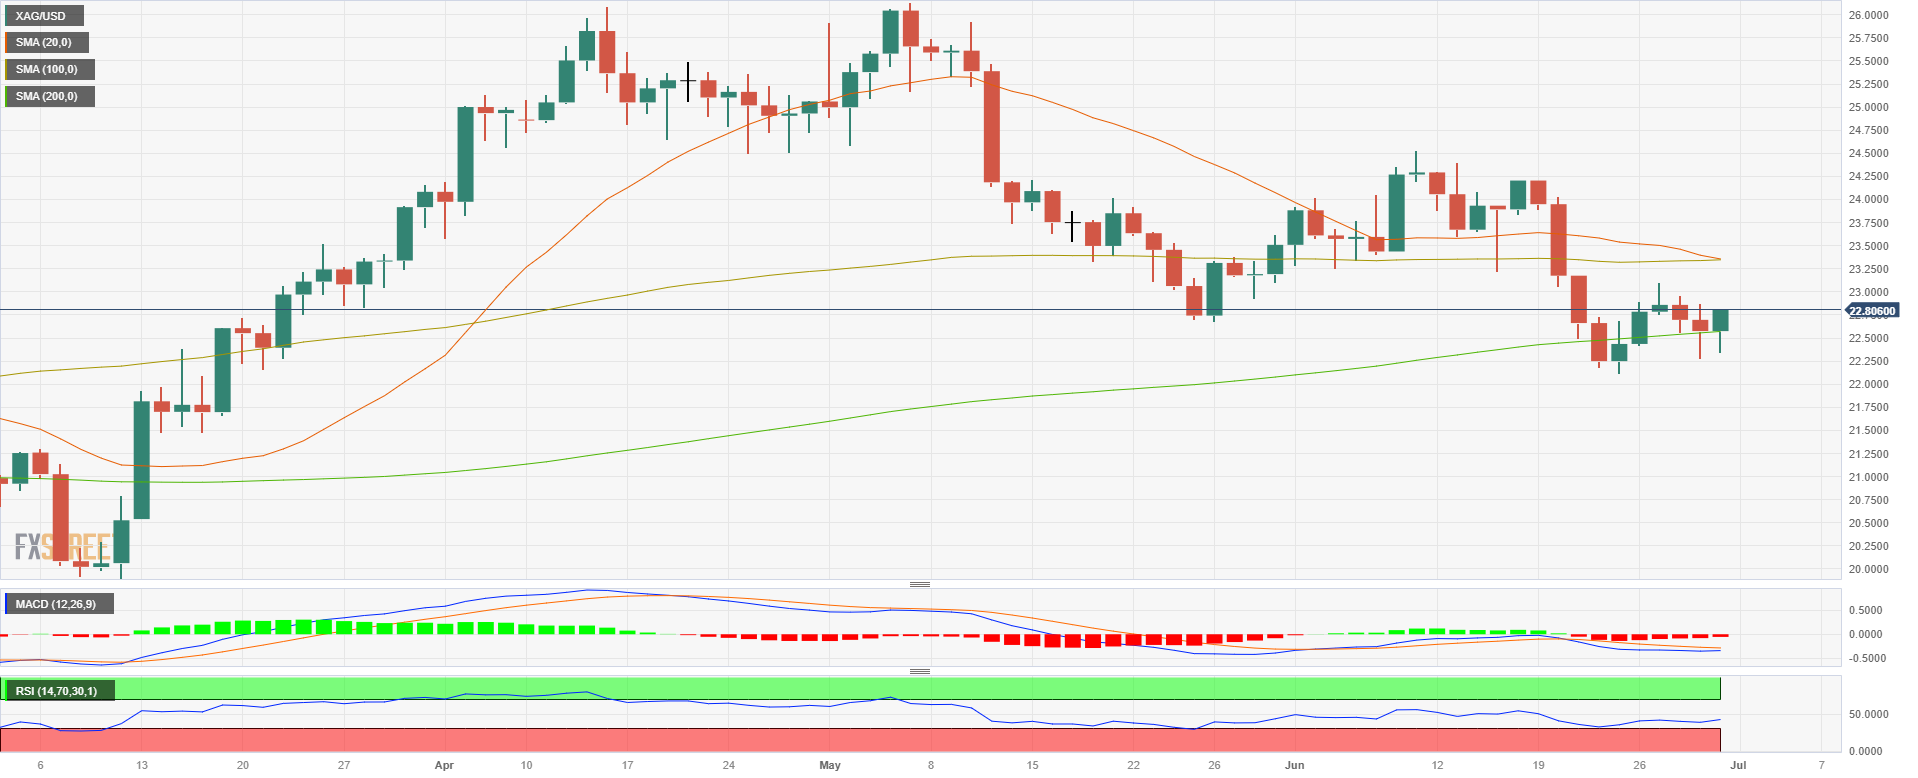
According to the daily chart, the XAG/USD appears bearish in the short term. The Relative Strength (RSI) and Moving Average Convergence Divergence (MACD) both remain in negative territory, suggesting that the sellers have the upperhand. In addition, traders should eye a bearish cross performed by the 20 and 100-day Simple Moving Average (SMA) of $23.35, which could fuel further downside.
On the downside, support levels to watch stand up at the 200-day SMA at $22.53, followed by $22.30 and June lows at $22.15. On the flipside, resistances are seen at $23.00 followed by $23.10 and the mentioned convergence of SMA’s at $23.35.
XAG/USD Daily chart
- SEO Powered Content & PR Distribution. Get Amplified Today.
- PlatoData.Network Vertical Generative Ai. Empower Yourself. Access Here.
- PlatoAiStream. Web3 Intelligence. Knowledge Amplified. Access Here.
- PlatoESG. Automotive / EVs, Carbon, CleanTech, Energy, Environment, Solar, Waste Management. Access Here.
- BlockOffsets. Modernizing Environmental Offset Ownership. Access Here.
- Source: https://www.fxstreet.com/news/silver-price-forecast-xag-usd-gains-ground-following-soft-pce-data-202306301705
- :is
- $UP
- 1
- 10
- 102
- 15%
- 20
- 30
- 70
- 9
- 90
- a
- above
- addition
- adp
- After
- amount
- an
- and
- ARE
- AS
- At
- average
- back
- BE
- bearish
- bond
- Bond yields
- boost
- both
- by
- CAN
- Chart
- claims
- Close
- considered
- Consumers
- consumption
- Convergence
- Core
- Cost
- could
- Cross
- daily
- data
- Decline
- Declines
- Divergence
- Dollar
- downside
- dropped
- Dropping
- Dxy
- energy
- excluding
- expectations
- experienced
- explained
- eye
- Falling
- falling short
- Figure
- flipside
- followed
- following
- food
- For
- Forecast
- Former
- Friday
- from
- Fuel
- further
- Gains
- Ground
- Have
- headline
- highest
- Highs
- holding
- HTTPS
- in
- Including
- Increase
- index
- IT
- ITS
- jobless claims
- june
- labor
- labor market
- Level
- levels
- losses
- lower
- Lows
- MACD
- March
- mark
- Market
- Market Data
- marking
- May..
- measures
- mentioned
- metal
- Metals
- Momentum
- money
- Month
- more
- moving
- moving average
- negative
- negative territory
- next
- Nonfarm
- Nonfarm Payrolls
- now
- of
- on
- Opportunity
- over
- Payrolls
- pce
- Peak
- performed
- personal
- plato
- Plato Data Intelligence
- PlatoData
- positions
- positive
- Precious
- Precious Metals
- price
- price forecast
- Prices
- Products
- Rates
- reached
- reaction
- registered
- relative
- release
- remain
- report
- response
- result
- Revealed
- rsi
- s
- seeing
- seen
- Sellers
- sense
- set
- Shifts
- Short
- should
- Silver
- Silver Price
- Simple
- since
- SMA
- Soft
- spend
- stand
- strength
- Subsequently
- such
- support
- support levels
- surpassed
- term
- territory
- than
- that
- The
- this
- thursday
- to
- Traders
- treasury
- two
- us
- US bond yields
- US Dollar
- USD
- volatile
- Watch
- week
- Weeks
- which
- while
- winning
- with
- witnessed
- Yield
- yields
- zephyrnet