Published 4 hours ago
SHIB Price Prediction: the Shiba Inu price continues its sideways trend as market sentiment continues to struggle in uncertainty. However, amid this consolidation, a new support trendline has emerged to support the coin buyers to eventually breach the overhead resistance of $0.00001168-0.00001150. Here’s why this resistance holds more significance to ensure a potential price rally.
advertisement
Key Points:
- The formation of ascending triangle pattern encourages Shiba Inu price of 22% rally
- A breakdown below the support trendline will invalidate the bullish theory
- The intraday trading volume of the Shiba Inu coin is $128.4 Million, showing a 14% gain.
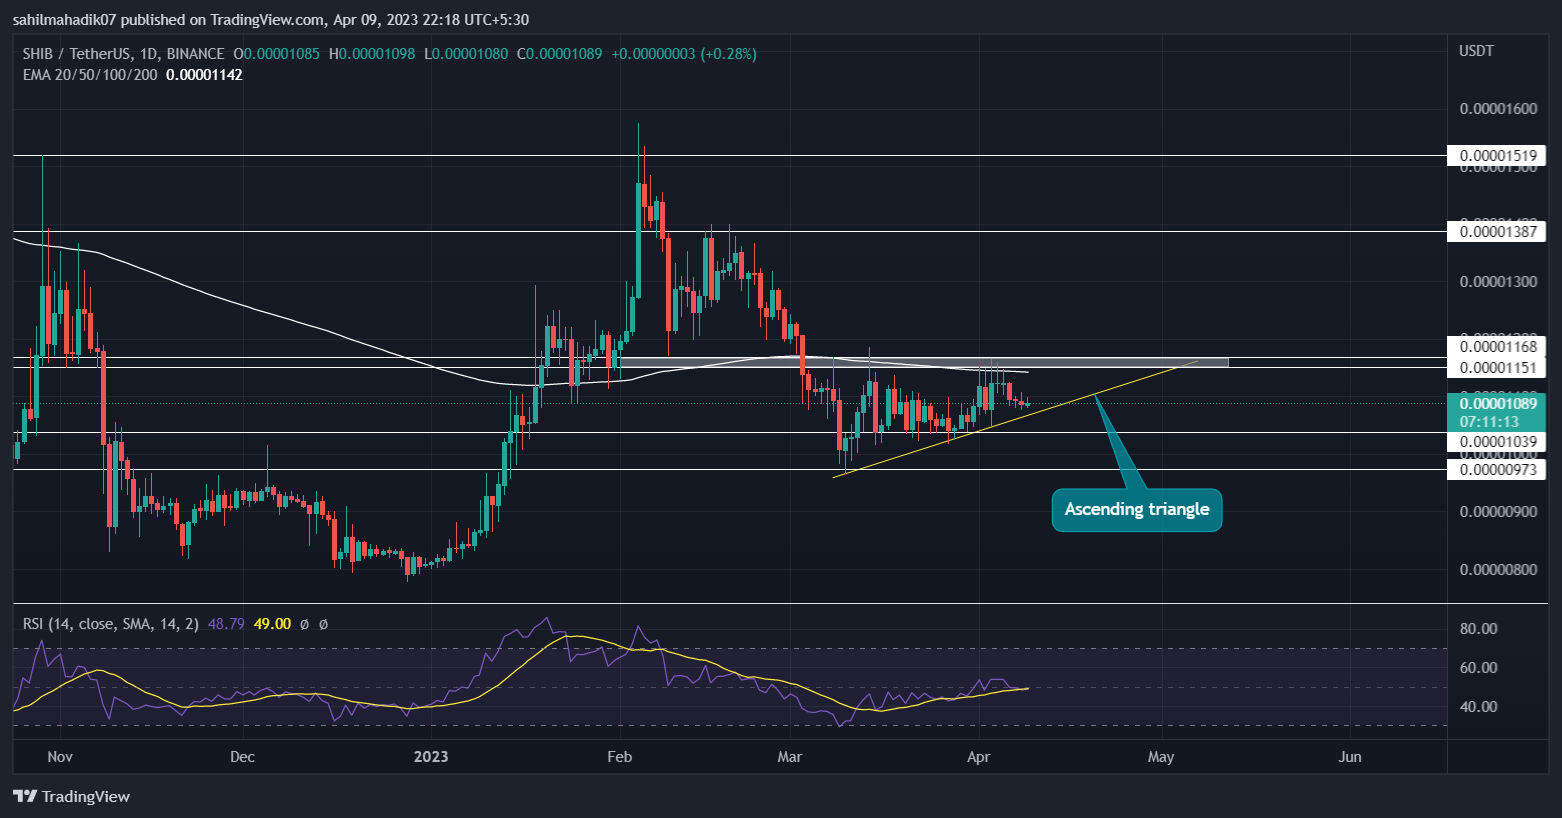
Source- Tradingview
In the daily time frame chart, the Shiba Inu price has been wobbling between a fixed horizontal resistance of $0.00001168-0.00001150 and rising trendline support for over a month. Despite the market sentiment, this type of consolidation showcases the formation of a famous bullish pattern candle ascending triangle.
In theory, the lower formation formed using the pattern’s support trendline indicates a gradual rise in bullish momentum. As of now, the Shiba Inu price trades at $0.0000109 and is approaching the rising trendline for another support.
Trending Stories
If the coin price manages to sustain above the trendline, the consolidation phase will likely continue for a few more sessions, but the buyers could challenge the $0.0000109 neckline to revive the prior recovery.
Also Read: What Is Regenerative Finance (Refi) And Who Is It For?
A daily candle closing above $0.0000109 will offer an entry-long opportunity with a potential target to reach $0.0000135.
Conversely, a breakdown below the trendline will undermine the bullish theory and trigger a longer correction.
Technical indicator
Relative strength index: Despite the price action moving sideways, the RSI slope manages to surpass the last swing high indicating the underlying buying pressure is rising which gives additional confirmation for a $0.0000109 breakout.
EMAs: the 200-day EMA moving near the $0.0000109 increases the resistance power of this level.
Shiba Inu Price Intraday Levels
- Spot price: $0.0000109
- Trend: Bullish
- Volatility: High
- Resistance levels- $0.0000116 and $0.0000125
- Support levels: $0.00001028 and $0.0000097
Share this article on:
advertisement
The presented content may include the personal opinion of the author and is subject to market condition. Do your market research before investing in cryptocurrencies. The author or the publication does not hold any responsibility for your personal financial loss.
<!– Close Story–>
- SEO Powered Content & PR Distribution. Get Amplified Today.
- Platoblockchain. Web3 Metaverse Intelligence. Knowledge Amplified. Access Here.
- Source: https://coingape.com/markets/shib-price-prediction-bullish-pattern-prepares-shiba-inu-price-for-22-upswing/
- :is
- 1
- 10
- 7
- 8
- 9
- a
- above
- Action
- Ad
- Additional
- Amid
- and
- Another
- approaching
- article
- AS
- At
- author
- avatar
- banner
- Beauty
- before
- below
- between
- blockchain
- breach
- Breakdown
- breakout
- Brian
- Bullish
- buyers
- Buying
- challenge
- Chart
- closing
- Coin
- Coingape
- COM
- condition
- confirmation
- consolidation
- content
- continue
- continues
- could
- cryptocurrencies
- cryptocurrency
- daily
- Despite
- different
- emerged
- encourages
- ensure
- Entertainment
- Ether (ETH)
- eventually
- famous
- Fashion
- few
- finance
- financial
- fixed
- follow
- For
- formation
- formed
- FRAME
- from
- Gain
- gives
- gradual
- Have
- High
- hold
- holds
- Horizontal
- HOURS
- However
- HTTPS
- i
- in
- include
- Including
- Increases
- index
- indicates
- indicating
- Inu
- investing
- IT
- ITS
- journalism
- jpg
- Last
- Level
- levels
- likely
- longer
- loss
- manages
- Market
- market research
- market sentiment
- million
- Momentum
- Month
- more
- moving
- Near
- New
- of
- offer
- on
- Opinion
- Opportunity
- past
- Pattern
- personal
- phase
- plato
- Plato Data Intelligence
- PlatoData
- plugin
- points
- potential
- power
- prediction
- Prepares
- presented
- pressure
- price
- PRICE ACTION
- Price Prediction
- price rally
- Prior
- Publication
- rally
- reach
- Read
- recovery
- ReFi
- regenerative
- Regenerative Finance
- research
- Resistance
- responsibility
- Revive
- Rise
- rising
- sentiment
- sessions
- Share
- SHIB
- SHIB Price
- Shiba
- Shiba Inu
- Shiba Inu Coin
- Shiba Inu Price
- sideways
- significance
- strength
- Struggle
- subject
- support
- surpass
- Swing
- Target
- The
- time
- to
- Topics
- trades
- Trading
- trading volume
- TradingView
- Trend
- trending
- trigger
- Uncertainty
- underlying
- Undermine
- variety
- volume
- which
- WHO
- will
- with
- working
- written
- years
- Your
- zephyrnet