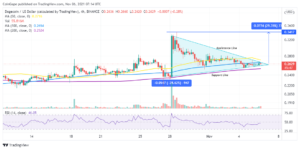
- Uniswap bulls have eyes on $32, but first, they must successfully break free from the shackles of the descending parallel channel.
- Polkadot bounces from the demand zone at $25 for the third time in September, targets $30 in the near term.
A bearish cloud keeps hovering over the cryptocurrency space; besides, declines have become a norm this September. However, it seems bulls will taking over from the bears mid-through this week. Some semblance of green is getting back to the market, led by Bitcoin, Binance Coin, and Solana.

Uniswap:-
Uniswap is making headway above the 100-day Simple Moving Average (SMA) following the most recent rejection at $26. The 50-day SMA added weight to the resistance experience earlier in the week in addition to the descending channel’s upper boundary.
The trend is mainly in the bulls’ hands, with UNI trading at slightly above $24. A break above the channel will most likely boost the price toward $28 ahead of another spike targeting the supply zone in red near $32.
At the same time, the Moving Average Convergence Divergence (MACD) adds credence to the bullish outlook after sending a buy signal. As the 12-day EMA crossed above the 26-day EMA, the odds favored the uptrend, explaining the nearly 4% rise on the day.
On the downside, Uniswap sits on robust support areas starting with the 100-day SMA. The channel’s middle boundary is also in line to offer support. If push comes to shove and losses soar, the demand zone in green will come in handy.
UNI/USD Daily Chart

Polkadot:-
Polkadot’s short-term technical outlook is aiming for $30 after retesting the key demand zone in green for the third time this month. At writing, the smart contracts token is teetering at $27 while bulls work on an effective recovery plan.
The Relative Strength Index (RSI) shows that bulls have a firm grip on DOT, and their influence is bound to grow in the coming sessions. As the RSI climbs above the midline, buyers become more aggressive.
DOT/USD Four-Hour Chart
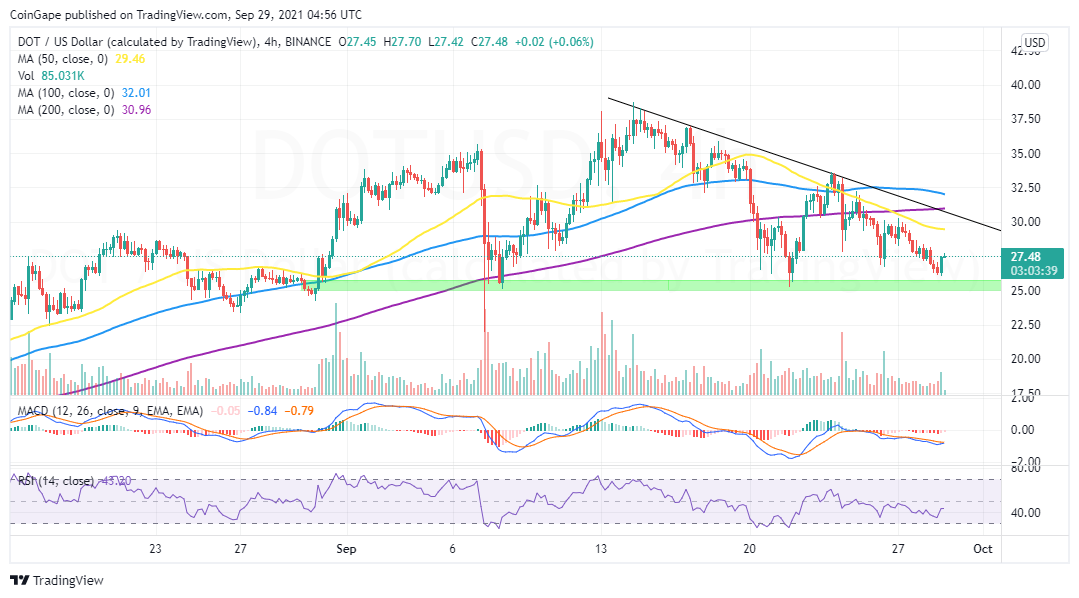
Subsequently, the MACD has a vivid bullish outlook with a buy signal on the brink of appearing in the four-hour timeframe. Nonetheless, some delay is anticipated at the 50-SMA and the descending trend line, as highlighted on the chart. Trading above $30 would be particularly bullish for Polkadot in the next few days.
- "
- Aiming
- analysis
- bearish
- Bears
- binance
- Binance Coin
- Bullish
- Bulls
- buy
- Cloud
- Coin
- coming
- content
- contracts
- cryptocurrencies
- cryptocurrency
- day
- delay
- Demand
- Effective
- EMA
- experience
- financial
- Firm
- First
- Free
- Green
- Grow
- Highlighted
- hold
- HTTPS
- index
- influence
- investing
- IT
- Key
- Led
- Line
- Making
- Market
- market research
- Near
- offer
- Opinion
- Outlook
- Polkadot
- price
- Price Analysis
- recovery
- research
- Share
- Simple
- smart
- Smart Contracts
- Solana
- Space
- supply
- support
- Technical
- time
- token
- Trading
- Uniswap
- week
- Work
- writing