- Natural Gas extends higher on Friday, though at a slower pace as the US Dollar finds a floor on the back of hawkish Fedspeak.
- The latest driver is the news that the Groningen Gas plant in the Netherlands will probably close in October 2023, a year earlier than previously thought.
- A weaker US Dollar following the ECB’s hawkish hike on Thursday adds further fuel to XNG/USD’s rally.
Natural Gas price has shot up over 14% so far this week, propelled by lower-than-expected storage data, hotter weather conditions (Gas is used for cooling as well as heating), reports of high-profile outages in Europe, a substantially weaker US Dollar, and expectations of keener demand from Asia.
XNG/USD is trading higher on Friday, extending a strong start and exchanging hands at $2.707 MMBtu, at the time of writing.
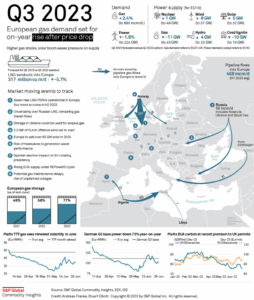
Natural Gas news and market movers
- Natural Gas gains support from rumors reported by Bloomberg that the Groningen Gas plant in the Netherlands could close a year earlier than expected – this October rather than next – due to mounting complaints because of political pressure from earthquakes caused by the plant damaging local residents’ homes.
- Weekly data from the US Energy Information Administration (EIA) showed an unexpected fall in Natural Gas Storage Change data to 84B cubic feet in the previous week when 95B had been forecast, suggesting demand outweighs supply.
- According to a report by Reuters, the Nyhamna Gas processing plant in Norway is experiencing technical problems that will put an end to production for a month. This is much longer than expected and rattles confidence in Norwegian supply.
- Commitment of Traders (COT) data tracking Gas futures positions from last week showed many traders were short Natural Gas futures. Many of these traders were caught in a ‘short squeeze’ this week, which led to panic covering, further adding fuel to the rally.
- XNG/USD experienced further upside from a substantial weakening of the US Dollar after the European Central Bank (ECB) executed a hawkish rate hike at its meeting on Thursday, strengthening the Euro and weighing on the US Dollar Index (DXY).
- The kicker came from the ECB revising up its forecasts for core inflation in 2023-4.
- ECB President Christine Lagarde made it clear the ECB would keep the door open to further rate hikes in the future during her press conference after the meeting.
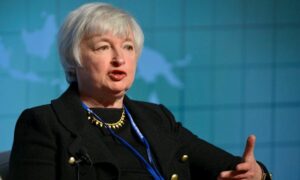
- That said, hawkish commentary from Federal Reserve’s Christopher Waller on Friday helps support the US Dollar, as does a higher-than-expected result for the University of Michigan Consumer Sentiment gauge.
- Natural Gas price is further underpinned by expectations of higher Asian demand and Russian pipeline disruptions.
- A hotter-than-expected summer drives increased demand for Natural Gas used in cooling, bolstering prices.
Natural Gas Technical Analysis: Recovering within a longer-term downtrend
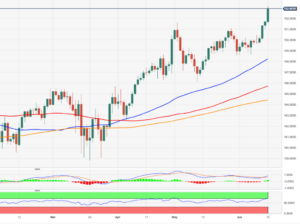
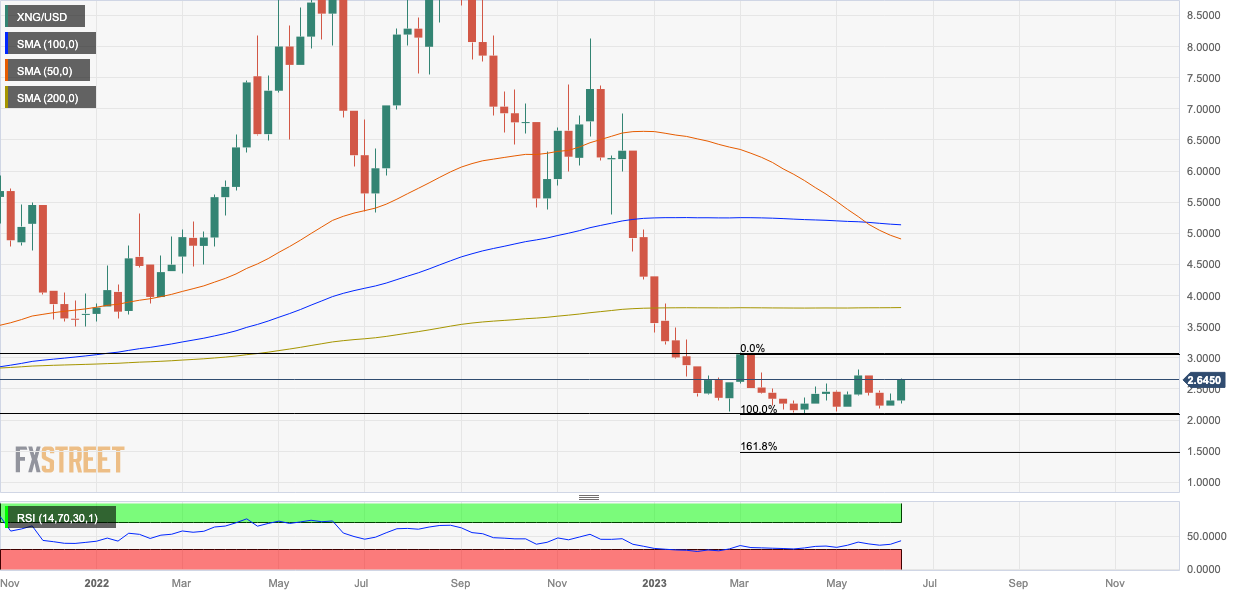
Natural Gas price remains in a long-term downtrend ever since turning lower from its peak of $9.960 MMBtu achieved in August 2022. That said, bearish momentum has tapered off considerably since February 2023, as evidenced by the bullish convergence of the Relative Strength Index (RSI) momentum indicator with price, beginning in May. Bullish convergence occurs when price makes new lows but RSI fails to copy. It can be indicative of a bullish reversal brewing.
Nevertheless, unless Natural Gas can break above the last lower high of the long-term downtrend at $3.079 MMBtu, the odds still favor an extension of the bear trend, and shorts over longs.
A break below the $2.110 MMBtu year-to-date lows would solidify the bearish outlook and suggest a continuation down to a target at $1.546 MMBtu, the 61.8% Fibonacci extension of the height of the roughly sideways consolidation range that has unfolded during 2023.
-638225177399817584.png)
Natural Gas: Weekly Chart
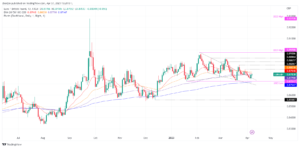
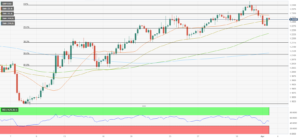
Scoping into the daily chart, it can be seen that price has now broken above both the 50 and not the 100-day Simple Moving Average (SMA), which is a short-term bullish sign.
-638225177811596463.png)
Natural Gas: Daily Chart
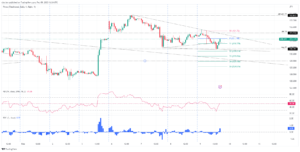
Looking at the 4-hour chart, the pair has been in a short-term uptrend since the start of June 2023, making successively higher highs and higher lows.
-638225178174675490.png)
Natural Gas: 4-hour Chart
This falls in line with the bullish RSI convergence observed on the weekly chart.
Yet on the 4-hour chart, RSI is now blinking ‘overbought’ (above 70), which is a signal for bulls not to add any new long positions. In the event of RSI exiting the overbought zone and returning to neutral territory, it would be a signal for short-term horizon bulls to close their long positions altogether, and is likely to be indicative of a pullback in price after the recent strong gains.
Natural Gas FAQs
What fundamental factors drive the price of Natural Gas?
Supply and demand dynamics are a key factor influencing Natural Gas prices, and are themselves influenced by global economic growth, industrial activity, population growth, production levels, and inventories. The weather impacts Natural Gas prices because more Gas is used during cold winters and hot summers for heating and cooling. Competition from other energy sources impacts prices as consumers may switch to cheaper sources. Geopolitical events are factors as exemplified by the war in Ukraine. Government policies relating to extraction, transportation, and environmental issues also impact prices.
What are the main macroeconomic releases that impact on Natural Gas Prices?
The main economic release influencing Natural Gas prices is the weekly inventory bulletin from the Energy Information Administration (EIA), a US government agency that produces US gas market data. The EIA Gas bulletin usually comes out on Thursday at 14:30 GMT, a day after the EIA publishes its weekly Oil bulletin. Economic data from large consumers of Natural Gas can impact supply and demand, the largest of which include China, Germany and Japan. Natural Gas is primarily priced and traded in US Dollars, thus economic releases impacting the US Dollar are also factors.
How does the US Dollar influence Natural Gas prices?
The US Dollar is the world’s reserve currency and most commodities, including Natural Gas are priced and traded on international markets in US Dollars. As such, the value of the US Dollar is a factor in the price of Natural Gas, because if the Dollar strengthens it means less Dollars are required to buy the same volume of Gas (the price falls), and vice versa if USD strengthens.
- SEO Powered Content & PR Distribution. Get Amplified Today.
- EVM Finance. Unified Interface for Decentralized Finance. Access Here.
- Quantum Media Group. IR/PR Amplified. Access Here.
- PlatoAiStream. Web3 Data Intelligence. Knowledge Amplified. Access Here.
- Source: https://www.fxstreet.com/news/natural-gas-price-burns-a-trail-higher-on-storage-data-european-plant-closures-hot-weather-202306161313
- :has
- :is
- :not
- $3
- $UP
- 10
- 11
- 110
- 12
- 14
- 15%
- 2022
- 2023
- 30
- 50
- 70
- 9
- a
- above
- achieved
- activity
- add
- adding
- Adds
- administration
- After
- agency
- also
- altogether
- an
- analysis
- and
- any
- ARE
- AS
- asia
- asian
- At
- AUGUST
- average
- back
- Bank
- BE
- Bear
- bearish
- Bearish Momentum
- because
- been
- Beginning
- below
- Bloomberg
- both
- Break
- Broken
- bulletin
- Bullish
- Bulls
- but
- buy
- by
- came
- CAN
- caught
- caused
- central
- Central Bank
- change
- Chart
- cheaper
- China
- Christine
- CHRISTINE LAGARDE
- Christopher
- Christopher Waller
- clear
- Close
- cold
- comes
- Commentary
- Commodities
- competition
- complaints
- conditions
- Conference
- confidence
- consolidation
- consumer
- consumer sentiment
- Consumers
- continuation
- Convergence
- Core
- core inflation
- could
- covering
- Currency
- daily
- damaging
- data
- day
- Demand
- disruptions
- does
- Dollar
- dollar index
- dollars
- Door
- down
- drive
- driver
- drives
- due
- during
- Dxy
- dynamics
- Earlier
- ECB
- Economic
- Economic growth
- EIA
- end
- energy
- environmental
- Euro
- Europa
- Europe
- European
- European Central Bank
- Event
- events
- EVER
- evidenced
- exchanging
- executed
- Exiting
- expanded
- expectations
- expected
- experienced
- experiencing
- extending
- extends
- extension
- extraction
- factor
- factors
- fails
- Fall
- Falls
- FAQ
- far
- favor
- February
- Federal
- federal reserve
- Feet
- finds
- Floor
- following
- For
- Forecast
- forecasts
- Friday
- from
- Fuel
- fundamental
- further
- future
- Futures
- Gains
- GAS
- Gas Price
- gas prices
- geopolitical
- Germany
- Global
- Global Economic
- GMT
- Government
- Growth
- had
- Hands
- Hawkish
- height
- helps
- her
- High
- high-profile
- higher
- Highs
- Hike
- Hikes
- Homes
- horizon
- HOT
- HTML
- HTTPS
- if
- Impact
- impacting
- Impacts
- in
- include
- Including
- increased
- index
- indicative
- Indicator
- industrial
- inflation
- influence
- influenced
- influencing
- information
- International
- into
- inventory
- issues
- IT
- ITS
- Japan
- june
- Keep
- Key
- key factor
- Lagarde
- large
- largest
- Last
- latest
- Led
- less
- levels
- likely
- Line
- local
- Long
- long-term
- longer
- lower
- Lows
- Macroeconomic
- made
- Main
- MAKES
- Making
- many
- Market
- Market Data
- Markets
- May..
- means
- meeting
- Michigan
- Momentum
- Month
- more
- most
- moving
- moving average
- much
- Natural
- Natural Gas
- Netherlands
- Neutral
- New
- news
- next
- Norway
- Norwegian
- now
- observed
- october
- Odds
- of
- off
- Oil
- on
- open
- Other
- out
- Outages
- over
- Pace
- pair
- Panic
- Peak
- pipeline
- plato
- Plato Data Intelligence
- PlatoData
- policies
- political
- population
- positions
- president
- press
- pressure
- previous
- previously
- price
- Prices
- primarily
- probably
- problems
- processing
- produces
- Production
- Publishes
- pullback
- put
- rally
- range
- Rate
- Rate Hike
- rate hikes
- rather
- recent
- recovering
- relative
- relative strength index
- Relative Strength Index (RSI)
- release
- Releases
- remains
- report
- Reported
- Reports
- required
- Reserve
- Reserve Currency
- result
- returning
- Reuters
- Reversal
- roughly
- rsi
- Rumors
- russian
- s
- Said
- same
- seen
- sentiment
- Short
- short-term
- shorts
- shot
- showed
- sideways
- sign
- Signal
- Simple
- since
- SMA
- So
- so Far
- Sources
- start
- Still
- storage
- strength
- strengthening
- Strengthens
- strong
- substantial
- substantially
- such
- suggest
- summer
- supply
- Supply and Demand
- support
- Switch
- Target
- Technical
- Technical Analysis
- territory
- than
- that
- The
- The Future
- the Netherlands
- The Weekly
- their
- themselves
- These
- this
- this week
- though?
- thought
- thursday
- time
- to
- Tracking
- traded
- Traders
- Trading
- transportation
- Trend
- Turning
- Ukraine
- underpinned
- Unexpected
- university
- University of Michigan
- University of Michigan Consumer Sentiment
- Upside
- uptrend
- us
- US Dollar
- US Dollar Index
- US Dollars
- us government
- USD
- used
- usually
- value
- volume
- war
- War in Ukraine
- Weather
- week
- weekly
- weighing
- WELL
- were
- when
- which
- will
- with
- within
- world’s
- would
- writing
- year
- zephyrnet