- Gold picks up as the ADP figures confirm that US labor market is cooling.
- The precious metal’s broader bullish trend is losing momentum as the Dollar regains lost ground.
- Further evidence that the US is heading into a soft landing underpins demand for Gold.
Gold (XAU/USD) prices have ticked up following the release of weaker-than-expected US ADP Employment figures. The pair is approaching Tuesday's highs at $2,040 after having found support at the $2,000 psychological level, on its reversal from the all-time highs at $2,150.
US Treasury yields have turned lower as the weak ADP cast doubt about Friday's Nonfarm Payrolls data. These figures confirm that the US labor market is losing momentum, which adds reasons to think that the Federal Reserve (Fed) might start easing its monetary policy early next year.
Data from Tuesday offered a mixed picture. The US ISM Services PMI beat expectations, but the US JOLTS job openings survey showed that the labour market is starting to feel the pinch of higher interest rates.
Investors' focus is now on the Nonfarm Payrolls report, due on Friday, which will be scrutinised with interest for further cues into the Fed’s monetary policy plans.
Daily Digest Market Movers: Gold ticks up as the ADP bolsters the case for Fed cuts in 2024
- Gold prices advanced as the ADP employment report showed a weaker-than-expected reading in October.
- The US economy created 103,000 new jobs in November, well below the 130,000 expected. October’s reading has been downwardly revised to 106,000 from the previously estimated 113,000.
- These figures follow the track of Tuesday's US JOLTS Job Openings survey, adding to evidence that the restrictive monetary policy is starting to hit demand for workers.
- On the other hand, the US ISM Services PMI showed a larger-than-expected improvement, which discards a sharp downturn in the US economy.
- The CME Group FedWatch Tool is pricing more than 50% chances that the US central bank will trim its benchmark rate by 25 basis points in March.
- Markets are in a moderately positive mood on Wednesday, with investors increasingly confident that the major central bank’s tightening cycles have ended.
- Recent data endorses the view of slowing US growth and a softer labour market, consistent with a soft landing narrative. This hurts the US Dollar and US yields, and it is good news for precious metals.
- News that Moody’s has cut China’s credit outlook to negative due to the increasing debt risks is weighing on risk appetite.
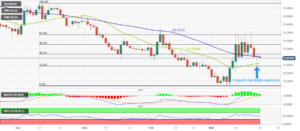
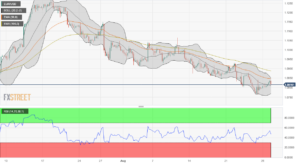
Technical Analysis: Gold prices remain consolidating below $2,040
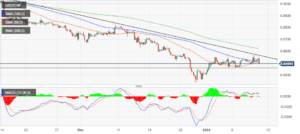
From a technical perspective, Gold prices remain in a consolidation mood. Downside attempts are contained above a key support area at $2,000, while upside attempts are capped below the $2,040 level.
The broader bullish trend has lost steam after breaking the 50% Fibonacci retracement level of the November 13 - December 5 bull run. Beyond that, Gold’s inverse correlation with a stronger US Dollar suggests that further decline should not be discarded.
On the downside, a confirmation below the $2,000 support area would negate the broader upside trend and increase bearish pressure towards $1,950 and $1,932.
On the upside, a bullish reaction above $2,040 would clear the path towards $2,067, ahead of the record-high $2,150.
US Dollar price this week
The table below shows the percentage change of US Dollar (USD) against listed major currencies this week. US Dollar was the weakest against the Canadian Dollar.
| USD | EUR | GBP | CAD | AUD | JPY | NZD | CHF | |
| USD | 0.94% | 0.99% | 0.67% | 1.72% | 0.69% | 1.16% | 0.80% | |
| EUR | -0.97% | 0.05% | -0.28% | 0.78% | -0.27% | 0.21% | -0.14% | |
| GBP | -1.02% | -0.05% | -0.32% | 0.74% | -0.30% | 0.16% | -0.19% | |
| CAD | -0.67% | 0.25% | 0.33% | 1.06% | 0.01% | 0.49% | 0.13% | |
| AUD | -1.75% | -0.80% | -0.75% | -1.08% | -1.06% | -0.56% | -0.94% | |
| JPY | -0.73% | 0.26% | 0.46% | 0.00% | 1.06% | 0.49% | 0.10% | |
| NZD | -1.17% | -0.20% | -0.16% | -0.47% | 0.58% | -0.45% | -0.35% | |
| CHF | -0.86% | 0.11% | 0.15% | -0.17% | 0.92% | -0.14% | 0.33% |
The heat map shows percentage changes of major currencies against each other. The base currency is picked from the left column, while the quote currency is picked from the top row. For example, if you pick the Euro from the left column and move along the horizontal line to the Japanese Yen, the percentage change displayed in the box will represent EUR (base)/JPY (quote).
Fed FAQs
Monetary policy in the US is shaped by the Federal Reserve (Fed). The Fed has two mandates: to achieve price stability and foster full employment. Its primary tool to achieve these goals is by adjusting interest rates.
When prices are rising too quickly and inflation is above the Fed’s 2% target, it raises interest rates, increasing borrowing costs throughout the economy. This results in a stronger US Dollar (USD) as it makes the US a more attractive place for international investors to park their money.
When inflation falls below 2% or the Unemployment Rate is too high, the Fed may lower interest rates to encourage borrowing, which weighs on the Greenback.
The Federal Reserve (Fed) holds eight policy meetings a year, where the Federal Open Market Committee (FOMC) assesses economic conditions and makes monetary policy decisions.
The FOMC is attended by twelve Fed officials – the seven members of the Board of Governors, the president of the Federal Reserve Bank of New York, and four of the remaining eleven regional Reserve Bank presidents, who serve one-year terms on a rotating basis.
In extreme situations, the Federal Reserve may resort to a policy named Quantitative Easing (QE). QE is the process by which the Fed substantially increases the flow of credit in a stuck financial system.
It is a non-standard policy measure used during crises or when inflation is extremely low. It was the Fed’s weapon of choice during the Great Financial Crisis in 2008. It involves the Fed printing more Dollars and using them to buy high grade bonds from financial institutions. QE usually weakens the US Dollar.
Quantitative tightening (QT) is the reverse process of QE, whereby the Federal Reserve stops buying bonds from financial institutions and does not reinvest the principal from the bonds it holds maturing, to purchase new bonds. It is usually positive for the value of the US Dollar.
- SEO Powered Content & PR Distribution. Get Amplified Today.
- PlatoData.Network Vertical Generative Ai. Empower Yourself. Access Here.
- PlatoAiStream. Web3 Intelligence. Knowledge Amplified. Access Here.
- PlatoESG. Carbon, CleanTech, Energy, Environment, Solar, Waste Management. Access Here.
- PlatoHealth. Biotech and Clinical Trials Intelligence. Access Here.
- Source: https://www.fxstreet.com/news/gold-prices-consolidate-as-focus-shifts-towards-us-adp-report-202312061135
- :has
- :is
- :not
- :where
- $UP
- 000
- 1
- 13
- 130
- 150
- 2%
- 2008
- 25
- 31
- 40
- 41
- a
- About
- above
- Achieve
- adding
- Adds
- adjusting
- adp
- ADP Employment Report
- advanced
- After
- against
- ahead
- all-time highs
- along
- analysis
- and
- Animate
- appetite
- approaching
- ARE
- AREA
- AS
- assesses
- At
- Attempts
- attractive
- Bank
- base
- basis
- BE
- bearish
- beat
- been
- below
- Benchmark
- Benchmark Rate
- Beyond
- board
- bolsters
- Bonds
- Borrowing
- Box
- Breaking
- broader
- bull
- Bull Run
- Bullish
- but
- buy
- Buying
- by
- Canadian
- Canadian Dollar
- case
- central
- Central Bank
- chances
- change
- Changes
- Chinas
- choice
- clear
- CME
- CME Group
- Column
- committee
- conditions
- confident
- Confirm
- confirmation
- consistent
- consolidation
- contained
- content
- Costs
- credit
- crises
- crisis
- currencies
- Currency
- Cut
- cuts
- cycles
- data
- Debt
- December
- decisions
- Decline
- Demand
- Digest
- displayed
- does
- Dollar
- dollars
- doubt
- downside
- DOWNTURN
- due
- during
- each
- Early
- easing
- Economic
- Economic Conditions
- economy
- eleven
- employment
- encourage
- ended
- Endorses
- ends
- estimated
- EUR
- Euro
- evidence
- example
- expanded
- expectations
- expected
- extreme
- extremely
- Falls
- FAQ
- Fed
- Federal
- Federal Open Market Committee
- federal reserve
- Federal Reserve Bank
- Federal Reserve Bank of New York
- feel
- Figures
- financial
- financial crisis
- Financial institutions
- financial system
- flow
- Focus
- follow
- following
- FOMC
- For
- Foster
- found
- four
- Friday
- from
- full
- further
- Goals
- Gold
- Gold Prices
- good
- governors
- grade
- great
- Greenback
- Ground
- Group
- Growth
- hand
- Have
- having
- Heading
- High
- higher
- Highs
- Hit
- holds
- Horizontal
- HTTPS
- hurts
- if
- improvement
- in
- Increase
- Increases
- increasing
- increasingly
- inflation
- institutions
- interest
- Interest Rates
- International
- international investors
- into
- Investors
- involves
- IT
- ITS
- Japanese
- Japanese Yen
- Job
- Jobs
- JOLTS Job Openings
- jpg
- Key
- labor
- labor market
- Labour
- landing
- left
- Level
- Line
- Listed
- losing
- lost
- Low
- lower
- major
- MAKES
- mandates
- map
- March
- Market
- May..
- measure
- meetings
- Members
- Metals
- might
- mixed
- module
- Momentum
- Monetary
- Monetary Policy
- money
- mood
- more
- move
- Movers
- Named
- NARRATIVE
- negative
- New
- New York
- news
- next
- Nonfarm
- Nonfarm Payrolls
- November
- now
- october
- of
- offered
- officials
- on
- open
- openings
- or
- Other
- Outlook
- pair
- Park
- path
- Payrolls
- percentage
- perspective
- pick
- picked
- Picks
- picture
- Place
- plans
- plato
- Plato Data Intelligence
- PlatoData
- pmi
- points
- policy
- positive
- Precious
- Precious Metals
- president
- Presidents
- pressure
- previously
- price
- Prices
- primary
- Principal
- printing
- process
- psychological
- purchase
- QE
- QT
- quantitative
- Quantitative Easing
- quickly
- quote
- raises
- Rate
- Rates
- reaction
- Reading
- reasons
- regional
- reinvest
- release
- remain
- remaining
- report
- represent
- Reserve
- reserve bank
- Resort
- Restrictive
- Results
- retracement
- Reversal
- reverse
- rising
- Risk
- risk appetite
- risks
- ROW
- Run
- s
- serve
- Services
- seven
- shaped
- sharp
- should
- showed
- Shows
- sideways
- situations
- Slowing
- Soft
- Stability
- start
- Starting
- starts
- Steam
- Stops
- stronger
- substantially
- Suggests
- support
- Survey
- system
- table
- Target
- Technical
- terms
- than
- that
- The
- the Fed
- their
- Them
- These
- think
- this
- this week
- throughout
- tightening
- to
- too
- tool
- top
- towards
- track
- trades
- treasury
- Treasury yields
- Trend
- Tuesday
- Turned
- two
- unemployment
- unemployment rate
- Upside
- us
- US Central Bank
- US Dollar
- US economy
- US ISM Services PMI
- US JOLTS Job Openings
- US yields
- USD
- used
- using
- usually
- value
- View
- was
- Wednesday
- week
- weighing
- weighs
- WELL
- when
- which
- while
- WHO
- will
- with
- workers
- would
- XAU/USD
- year
- Yen
- yields
- york
- you
- zephyrnet