Ethereum price is struggling to clear the $1,885 zone against the US Dollar. ETH could start a decent recovery if there is a close above $1,885 and $1,900.
- Ethereum is showing a few bearish signs from the $1,885 resistance.
- The price is trading below $1,870 and the 100-hourly Simple Moving Average.
- There is a major bullish trend line forming with support near $1,858 on the hourly chart of ETH/USD (data feed via Kraken).
- The pair could decline sharply if there is a close below the $1,850 support.
Ethereum Price Faces Rejection
Ethereum’s price attempted a short-term recovery wave above the $1,850 zone. ETH was able to recover above the $1,855 and $1,870 levels, similar to Bitcoin.
However, the bears protected more upsides above the $1,885 resistance zone. A high was formed near $1,887 and the price reacted to the downside. There was a drop below the $1,870 level and the 100-hourly Simple Moving Average.
Ether declined below the 50% Fib retracement level of the recovery wave from the $1,832 swing low to the $1,887 high. It is now trading below $1,870 and the 100-hourly Simple Moving Average.
There is also a major bullish trend line forming with support near $1,858 on the hourly chart of ETH/USD. The trend line is close to the 61.8% Fib retracement level of the recovery wave from the $1,832 swing low to the $1,887 high.
On the upside, immediate resistance is near the $1,870 level and the 100 hourly SMA. The first major resistance is near the $1,885 level. The next key resistance is near the $1,900 level, above which the price might rise toward the $1,920 resistance.
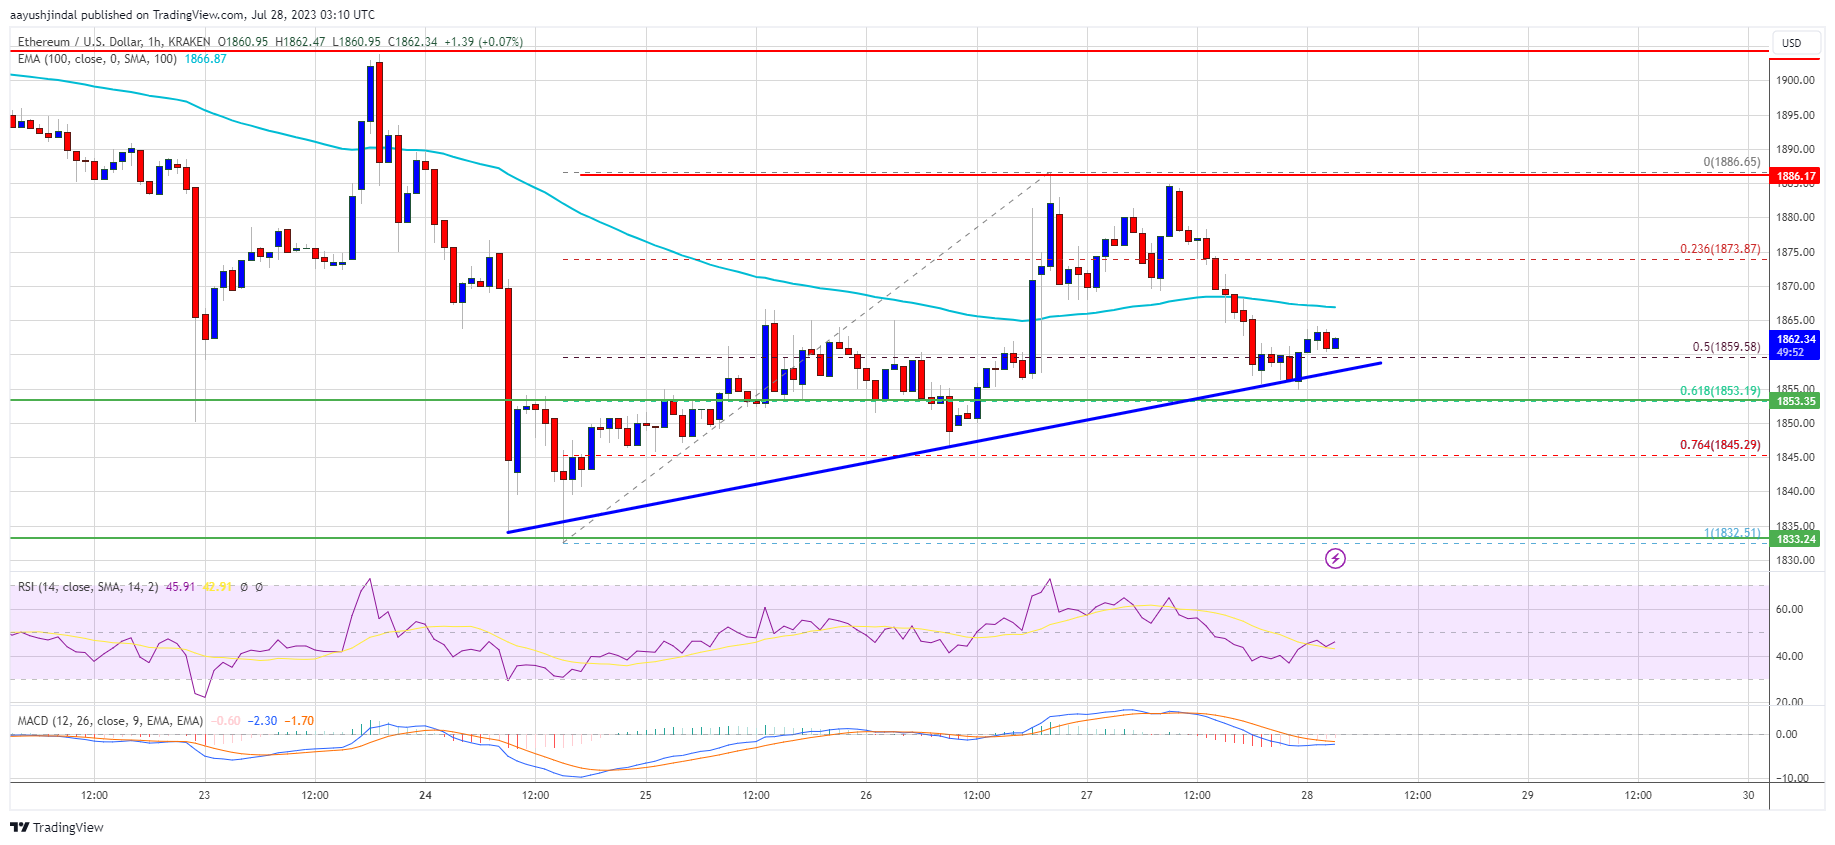
Source: ETHUSD on TradingView.com
A close above the $1,920 resistance could start a steady increase. The next resistance is near the $1,975 zone, above which the price might rise toward the $2,000 hurdle.
More Losses in ETH?
If Ethereum fails to clear the $1,885 resistance, it could continue to move down. Initial support on the downside is near the $1,855 level and the trend line.
The first major support is near the $1,850 zone, below which the price might revisit the $1,830 zone. The next major support is near the $1,780 support level.
Technical Indicators
Hourly MACD – The MACD for ETH/USD is losing momentum in the bullish zone.
Hourly RSI – The RSI for ETH/USD is now below the 50 level.
Major Support Level – $1,850
Major Resistance Level – $1,900
- SEO Powered Content & PR Distribution. Get Amplified Today.
- PlatoData.Network Vertical Generative Ai. Empower Yourself. Access Here.
- PlatoAiStream. Web3 Intelligence. Knowledge Amplified. Access Here.
- PlatoESG. Automotive / EVs, Carbon, CleanTech, Energy, Environment, Solar, Waste Management. Access Here.
- BlockOffsets. Modernizing Environmental Offset Ownership. Access Here.
- Source: https://www.newsbtc.com/analysis/eth/ethereum-price-downsides-1850/
- :is
- 000
- 100
- 50
- a
- Able
- above
- against
- also
- and
- attempted
- average
- avoid
- bearish
- bearish signs
- Bears
- below
- Bullish
- Chart
- clear
- Close
- Closes
- continue
- could
- data
- Decline
- Dollar
- down
- downside
- downsides
- Drop
- ETH
- ETH/USD
- ethereum
- Ethereum Price
- faces
- fails
- few
- First
- For
- formed
- from
- High
- HTTPS
- if
- immediate
- in
- Increase
- initial
- IT
- Key
- key resistance
- Kraken
- Level
- levels
- Line
- losing
- losses
- Low
- MACD
- major
- max-width
- might
- Momentum
- more
- move
- moving
- moving average
- Near
- NewsBTC
- next
- now
- of
- on
- ONE
- pair
- plato
- Plato Data Intelligence
- PlatoData
- price
- protected
- Recover
- recovery
- Resistance
- retracement
- Rise
- rsi
- short-term
- showing
- Signs
- similar
- Simple
- SMA
- start
- steady
- Struggling
- support
- support level
- Swing
- The
- There.
- to
- toward
- Trading
- TradingView
- Trend
- Upside
- us
- US Dollar
- via
- was
- Wave
- which
- with
- zephyrnet