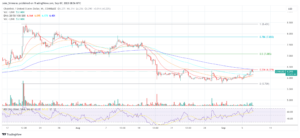
Bitcoin price extended its rally above the $42,000 resistance. BTC is now correcting gains and might test the $40,800 support zone.
- Bitcoin surged further above the $41,200 and $42,000 levels.
- The price is trading above $41,200 and the 100 hourly Simple moving average.
- There is a major bullish trend line forming with support near $40,880 on the hourly chart of the BTC/USD pair (data feed from Kraken).
- The pair could correct lower toward $40,800 before it starts a fresh increase.
Bitcoin Price Rises Over 10%
Bitcoin price started a strong increase above the $38,500 resistance zone. BTC gained over 10% in the past few sessions and broke many hurdles near $40,000.
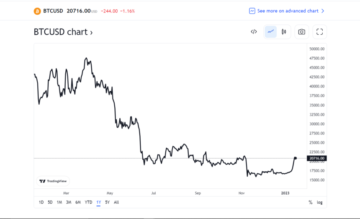
It even cleared the $41,200 resistance and spiked above the $42,000 zone. A new multi-month high is formed near $42,415 and the price is now correcting gains. There was a move below the $42,000 level. The price is now testing the 23.6% Fib retracement level of the upward move from the $39,360 swing low to the $42,415 high.
Bitcoin also trades above $41,200 and the 100 hourly Simple moving average. Besides, there is a major bullish trend line forming with support near $40,880 on the hourly chart of the BTC/USD pair. The trend line is close to the 50% Fib retracement level of the upward move from the $39,360 swing low to the $42,415 high.
On the upside, immediate resistance is near the $42,200 level. The first major resistance is forming near $42,500, above which the price might rise toward the $43,200 level.

Source: BTCUSD on TradingView.com
A close above the $43,200 resistance might send the price further higher. The next key resistance could be near $44,000, above which BTC could rise toward the $45,000 level.
Are Dips Limited In BTC?
If Bitcoin fails to rise above the $42,200 resistance zone, it could start a downside correction. Immediate support on the downside is near the $41,200 level.
The next major support is near $40,800 and the trend line. If there is a move below $40,800, there is a risk of more downsides. In the stated case, the price could drop toward the $40,000 support in the near term.
Technical indicators:
Hourly MACD – The MACD is now losing pace in the bullish zone.
Hourly RSI (Relative Strength Index) – The RSI for BTC/USD is now above the 50 level.
Major Support Levels – $41,200, followed by $40,800.
Major Resistance Levels – $42,200, $42,500, and $43,200.
- SEO Powered Content & PR Distribution. Get Amplified Today.
- PlatoData.Network Vertical Generative Ai. Empower Yourself. Access Here.
- PlatoAiStream. Web3 Intelligence. Knowledge Amplified. Access Here.
- PlatoESG. Carbon, CleanTech, Energy, Environment, Solar, Waste Management. Access Here.
- PlatoHealth. Biotech and Clinical Trials Intelligence. Access Here.
- Source: https://www.newsbtc.com/analysis/btc/bitcoin-price-extends-rally-42k/
- :is
- 000
- 1
- 100
- 200
- 23
- 360
- 50
- 500
- a
- above
- also
- and
- appear
- average
- BE
- before
- below
- besides
- Bitcoin
- Bitcoin Price
- Broke
- BTC
- BTC/USD
- Bullish
- but
- by
- case
- Chart
- Close
- correct
- could
- data
- downside
- downsides
- Drop
- Even
- extended
- extends
- fails
- few
- First
- followed
- For
- formed
- fresh
- fresh increase
- from
- further
- gained
- Gains
- High
- higher
- HTTPS
- Hurdles
- if
- immediate
- in
- Increase
- index
- Indicators
- IT
- ITS
- Key
- key resistance
- Kraken
- Level
- levels
- Limited
- Line
- losing
- Low
- lower
- MACD
- major
- many
- max-width
- might
- more
- move
- moving
- moving average
- Near
- New
- NewsBTC
- next
- now
- of
- on
- over
- Pace
- pair
- past
- plato
- Plato Data Intelligence
- PlatoData
- price
- rally
- relative
- relative strength index
- Resistance
- retracement
- Rise
- Rises
- Risk
- rsi
- send
- sessions
- Signs
- Simple
- start
- started
- starts
- stated
- strength
- support
- support levels
- Surged
- Swing
- term
- test
- Testing
- The
- There.
- to
- toward
- trades
- Trading
- TradingView
- Trend
- Upside
- upward
- was
- which
- with
- zephyrnet