Ethereum price is attempting an upside correction above $1,500 against the US Dollar. ETH could start another decline if there is no increase above $1,600.
- Ethereum is slowly moving higher above the $1,500 resistance.
- The price is now trading above $1,510 and the 100 hourly simple moving average.
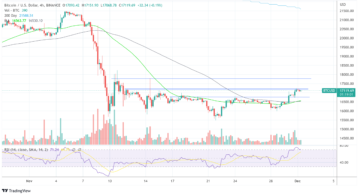
- There was a break above a major bearish trend line with resistance near $1,515 on the hourly chart of ETH/USD (data feed via Kraken).
- The pair could continue to move up if it clears the $1,600 resistance zone.
Ethereum Price Breaks Barrier
Ethereum price formed a decent support base above the $1,460 level. ETH started a steady increase after the US CPI release, similar to bitcoin. There was a clear move above the $1,500 resistance zone.
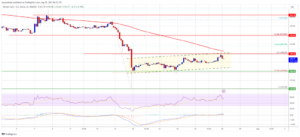
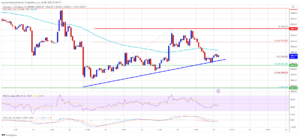
Besides, there was a break above a major bearish trend line with resistance near $1,515 on the hourly chart of ETH/USD. The pair even spiked above the $1,560 resistance zone. A high is formed near $1,569 and the price is now consolidating gains.
Ether price is now trading above $1,510 and the 100 hourly simple moving average. It is also above the 23.6% Fib retracement level of the upward move from the $1,464 swing low to $1,569 high.
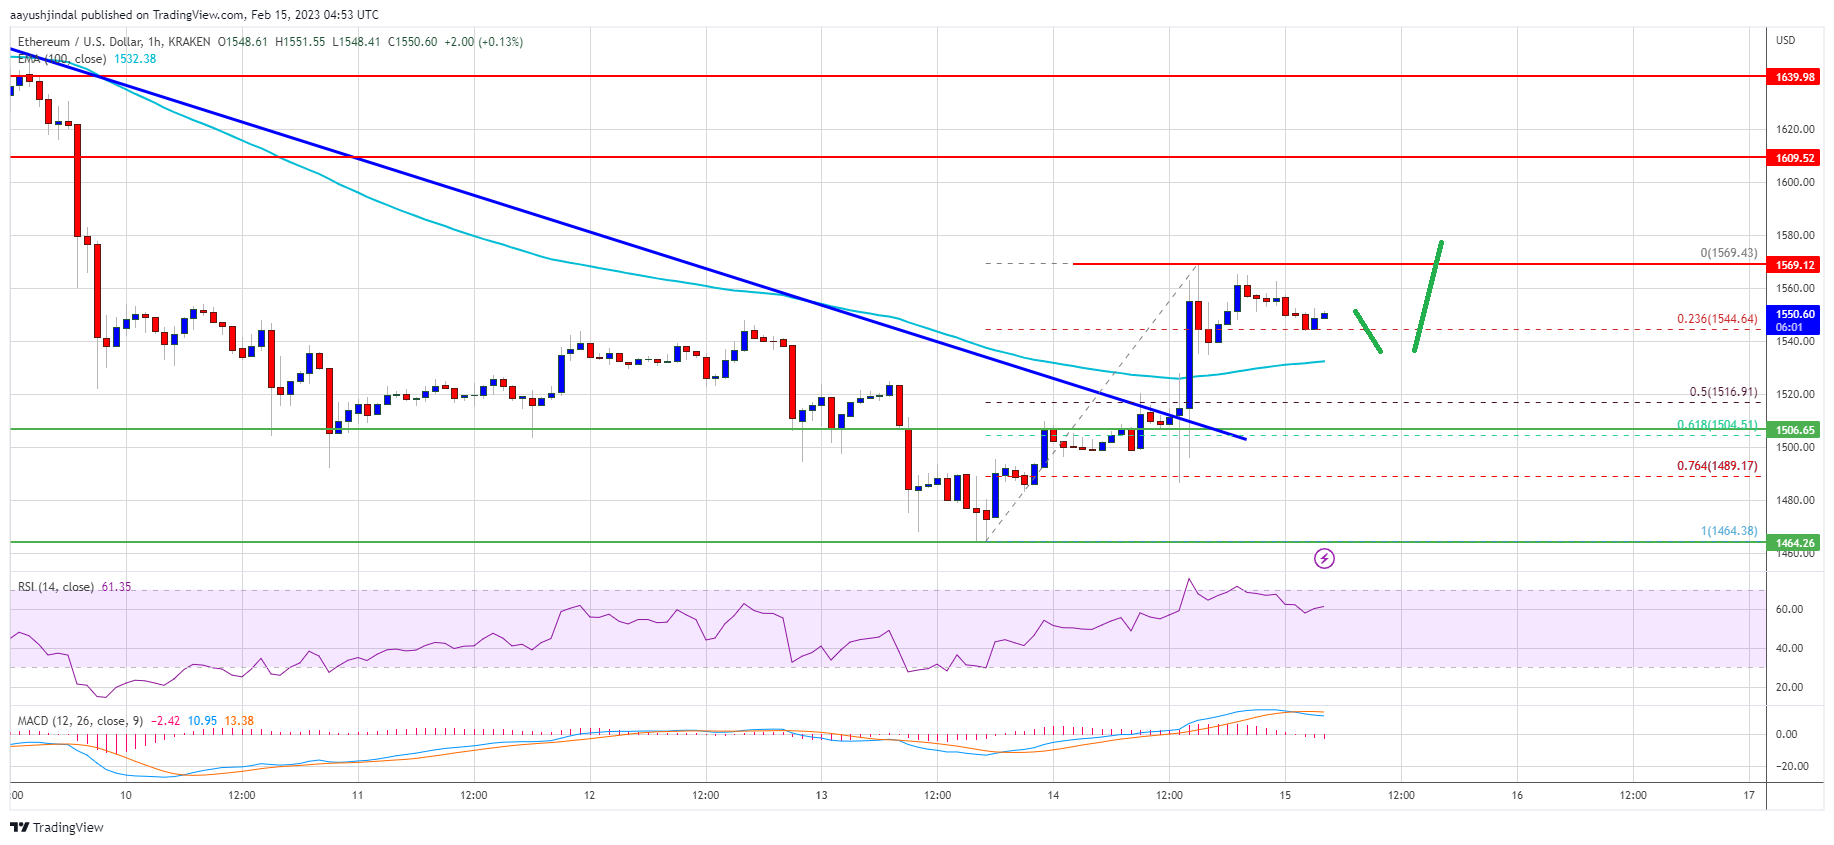
Source: ETHUSD on TradingView.com
On the upside, the price is facing resistance near the $1,570 level. The next major resistance is near the $1,600 zone. An upside break above the $1,600 resistance zone could start a steady uptrend. In the stated case, the price may perhaps rise towards the $1,640 resistance. The next major resistance is near the $1,700 level.
Fresh Decline in ETH?
If ethereum fails to clear the $1,570 resistance or the $1,600 barrier, it could start another decline. An initial support on the downside is near the $1,530 level and the 100 hourly SMA.
The next major support is near the $1,500 zone or the 61.8% Fib retracement level of the upward move from the $1,464 swing low to $1,569 high. If there is a break below $1,500, the price might continue to drop and move towards the $1,460 support. Any more losses might call for a test of the $1,400 level.
Technical Indicators
Hourly MACD – The MACD for ETH/USD is now losing momentum in the bullish zone.
Hourly RSI – The RSI for ETH/USD is now above the 50 level.
Major Support Level – $1,500
Major Resistance Level – $1,600
- SEO Powered Content & PR Distribution. Get Amplified Today.
- Platoblockchain. Web3 Metaverse Intelligence. Knowledge Amplified. Access Here.
- Source: https://www.newsbtc.com/analysis/eth/ethereum-price-breaks-1500/
- 100
- a
- above
- After
- against
- and
- Another
- attempting
- average
- barrier
- base
- bearish
- Bears
- below
- Break
- breaks
- Bullish
- call
- case
- Chart
- clear
- consolidating
- continue
- could
- CPI
- data
- Decline
- Dollar
- downside
- Drop
- ETH
- ETH/USD
- ethereum
- Ethereum Price
- Even
- facing
- fails
- formed
- from
- Gains
- High
- higher
- HTTPS
- in
- Increase
- initial
- IT
- Kraken
- Level
- Line
- losing
- losses
- Low
- MACD
- major
- max-width
- might
- Momentum
- more
- move
- moving
- moving average
- Near
- NewsBTC
- next
- perhaps
- plato
- Plato Data Intelligence
- PlatoData
- price
- release
- Resistance
- retracement
- Rise
- rsi
- similar
- Simple
- Slowly
- SMA
- start
- started
- stated
- steady
- support
- support level
- test
- The
- to
- towards
- Trading
- TradingView
- Trend
- Upside
- uptrend
- upward
- us
- US CPI
- US Dollar
- via
- zephyrnet