Executive Summary
- The digital asset market has posted impressive returns in 2023, with both BTC and ETH outperforming traditional assets like gold by 93% and 39%, respectively.
- Market corrections for the two majors have been meaningfully shallower than previous cycles, suggesting a investor support and positive capital inflows are in play.
- Our Altseason indicator has flagged the first meaningful appreciation against USD since the cycle peak. However it is important to note that this is within the context of Bitcoin dominance continuing to rise, with the BTC market cap rising by 110% YTD.

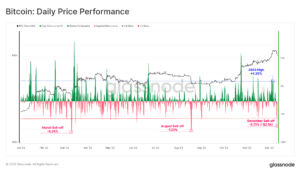
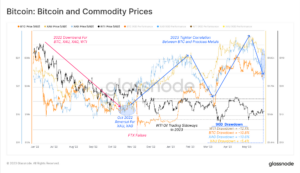
Bitcoin prices have rallied over +30% in recent weeks, driven in part by positive progress related to the various Bitcoin ETF applications which are sitting with the SEC for approval. Also of note is the relative performance of BTC and digital assets at large compared to traditional asset classes such as commodities, precious metals, equities and bonds.
In this edition, we will explore this impressive relative performance of digital assets through 2023. Thus far, both BTC and ETH have out-performed traditional assets significantly, whilst also experiencing shallower drawdowns compared to prior cycles.
Relative Resilience
The chart below compares BTC and ETH price in gold denomination, demonstrating performance compared to the traditional defensive store of value. BTC has appreciated +93% relative to gold in 2023, whilst ETH is up 39% in gold terms. This strong performance comes amidst increasing global uncertainty, which is likely catching the eye of many traditional investors.
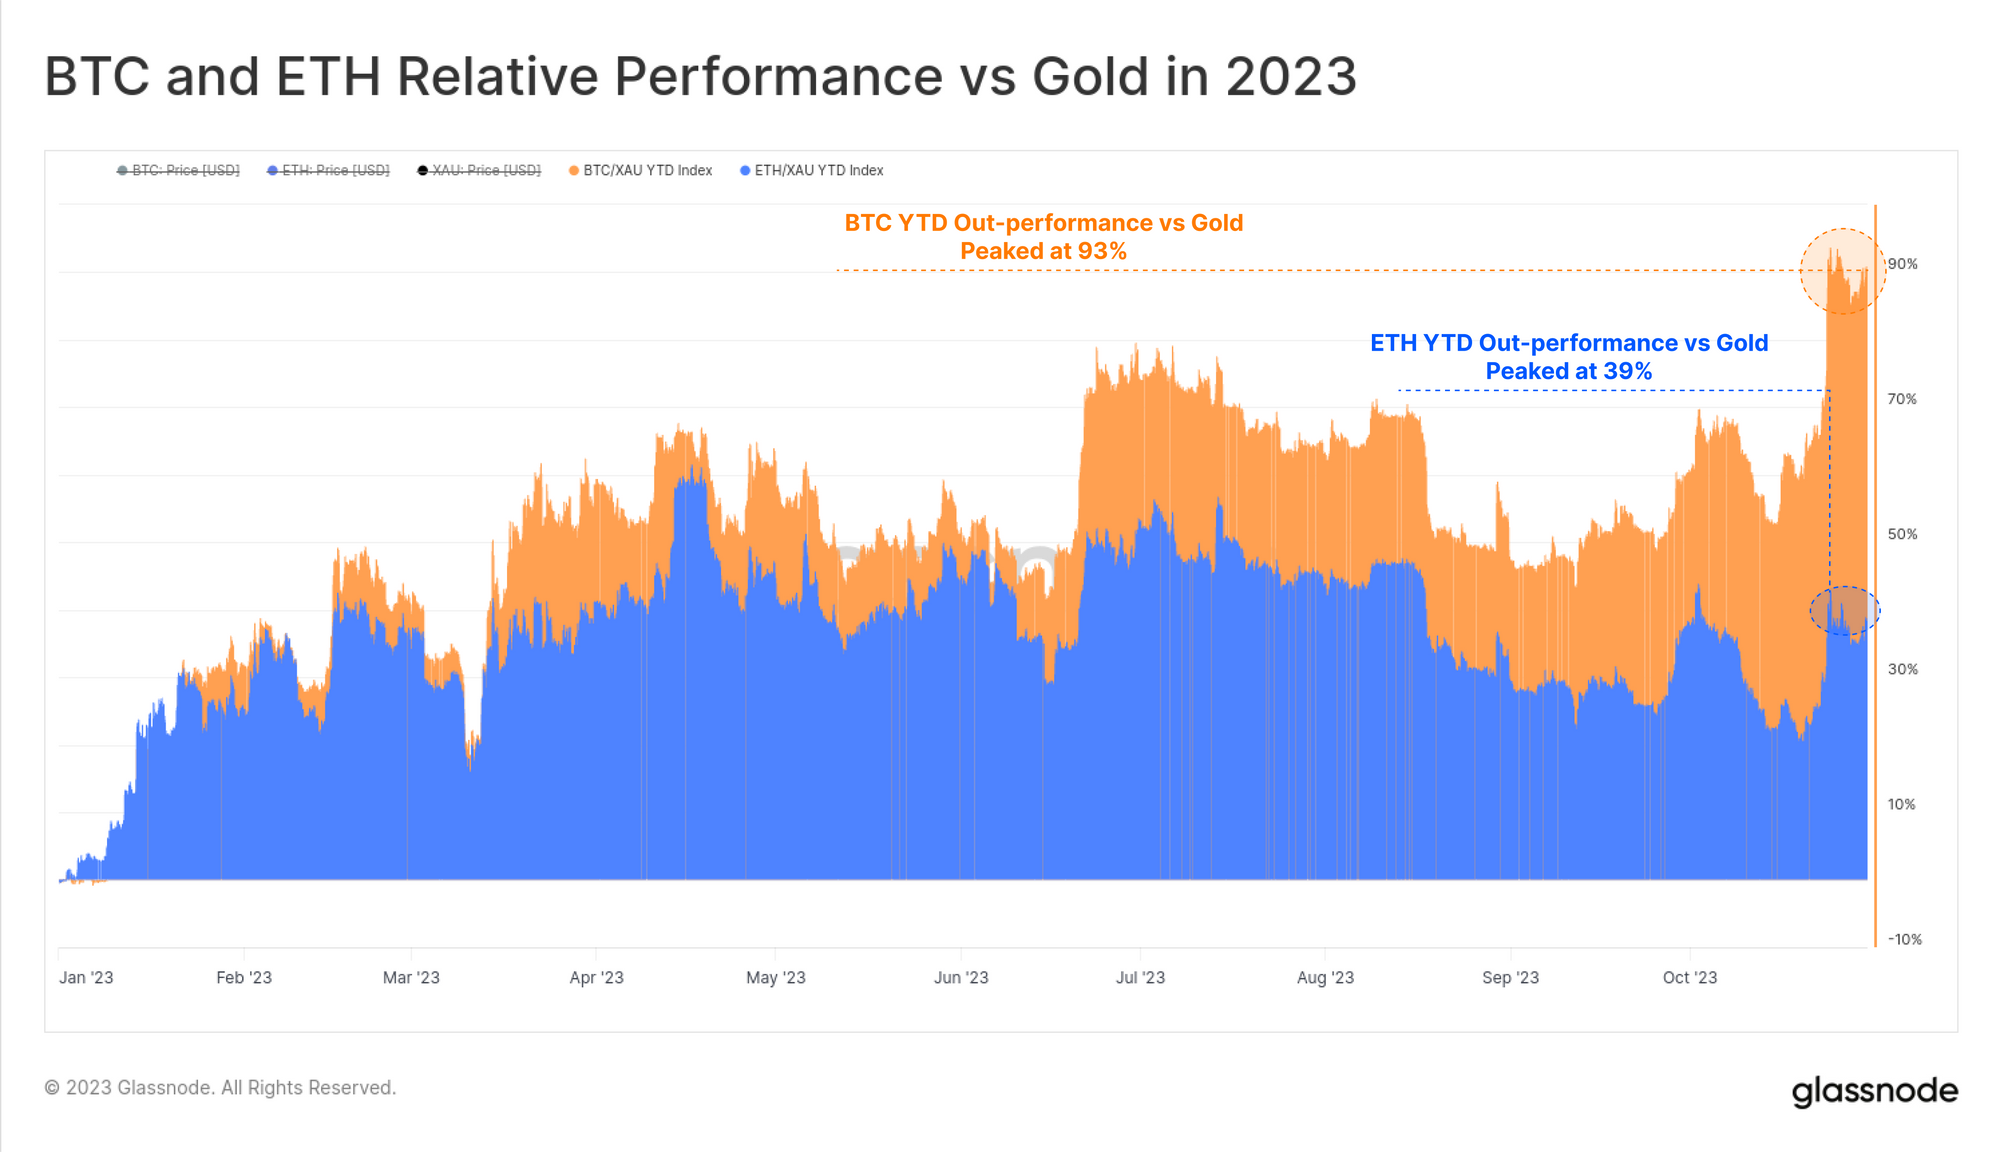
We can see that on a rolling 30-day basis, BTC 🟧 and ETH 🟦 returns have been tightly correlated throughout 2023. Both assets have experienced similar magnitude downswings, however Bitcoin has seen stronger performance during upswing periods.

We can also see the relative volatility of both digital assets exceeds that of Gold (in black), which is trading with smaller price moves in both directions.

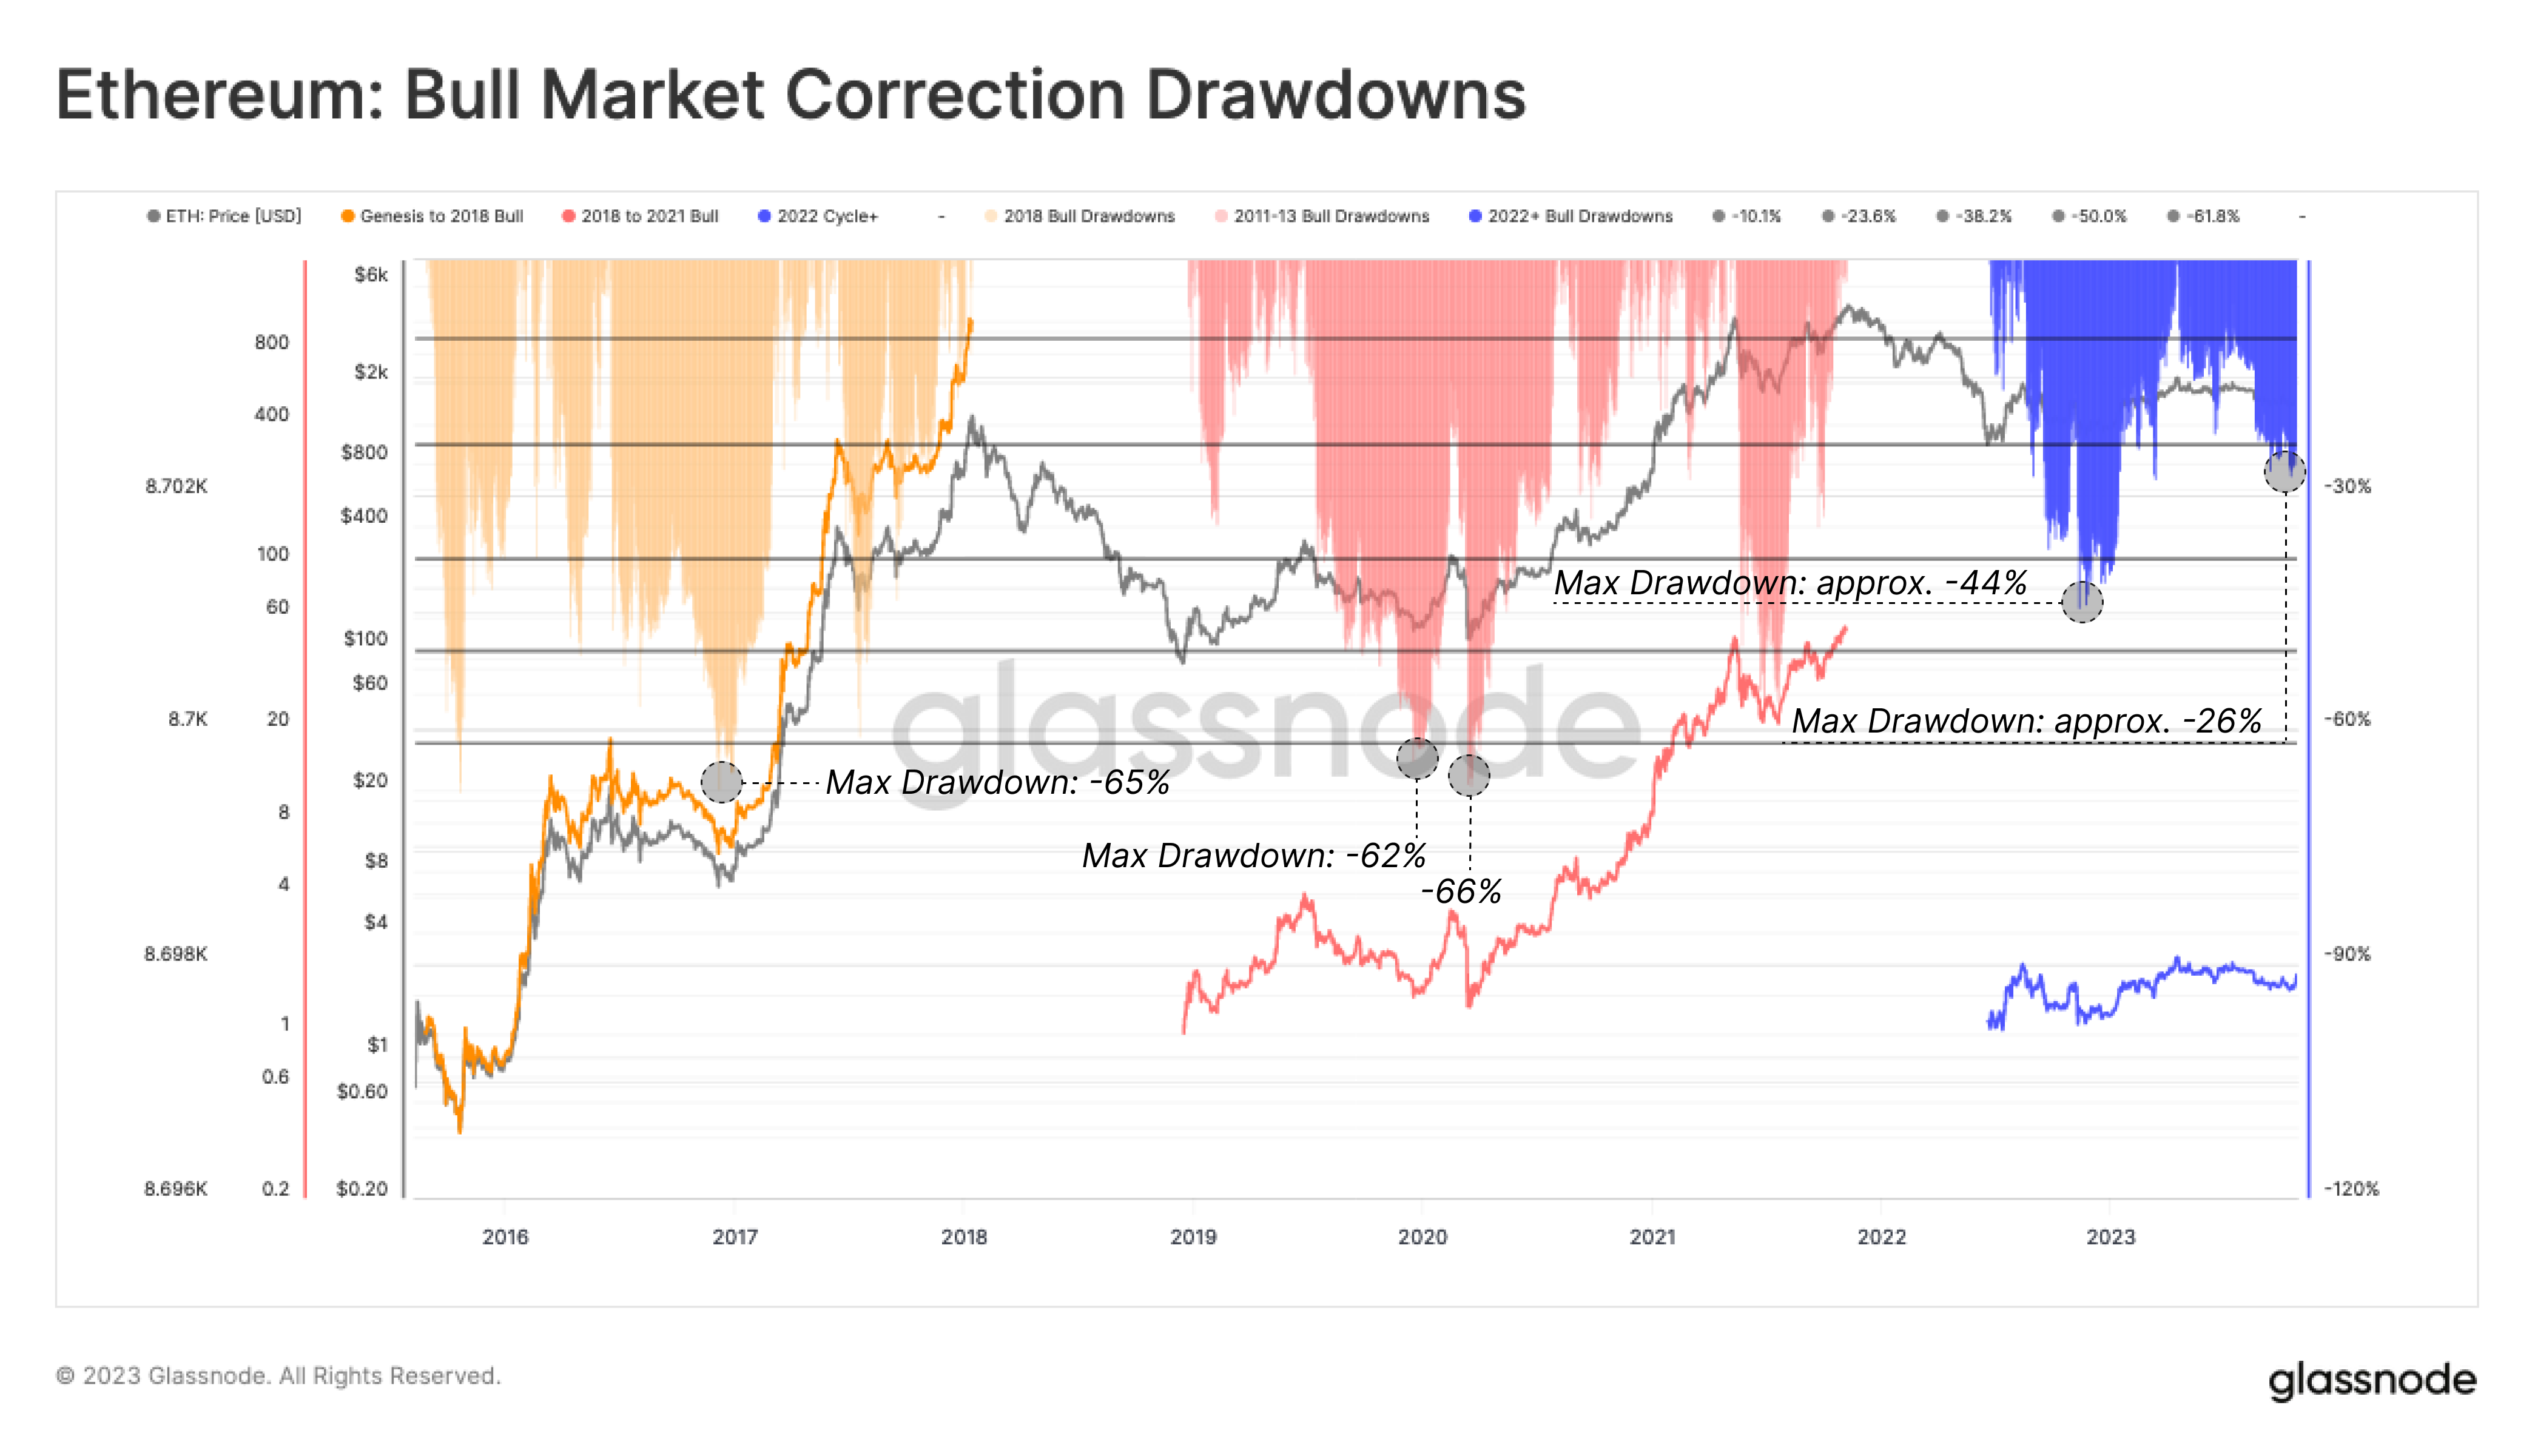
The relative strength of digital assets can also be observed by assessing the deepest correction during a macro uptrend. Here we will assess this metric for ETH, as it enables us to see performance relative to USD (an external benchmark), but also compared to the market leader BTC (an internal benchmark).
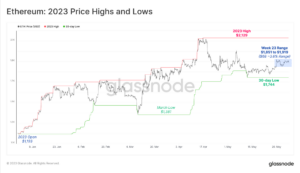
We consider the cycle low for ETH/USD as being set in June 2022 following the collapse of 3AC, Celcius and LUNA-UST. Since then, the deepest ETH/USD correction (relative to the local high) has been -44%, set during the failure of FTX. Today, ETH is trading -26% below its 2023 high of $2,118, which is substantially stronger performance than the -60% or larger drawdowns seen in previous cycles.
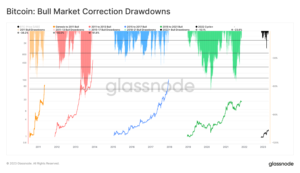
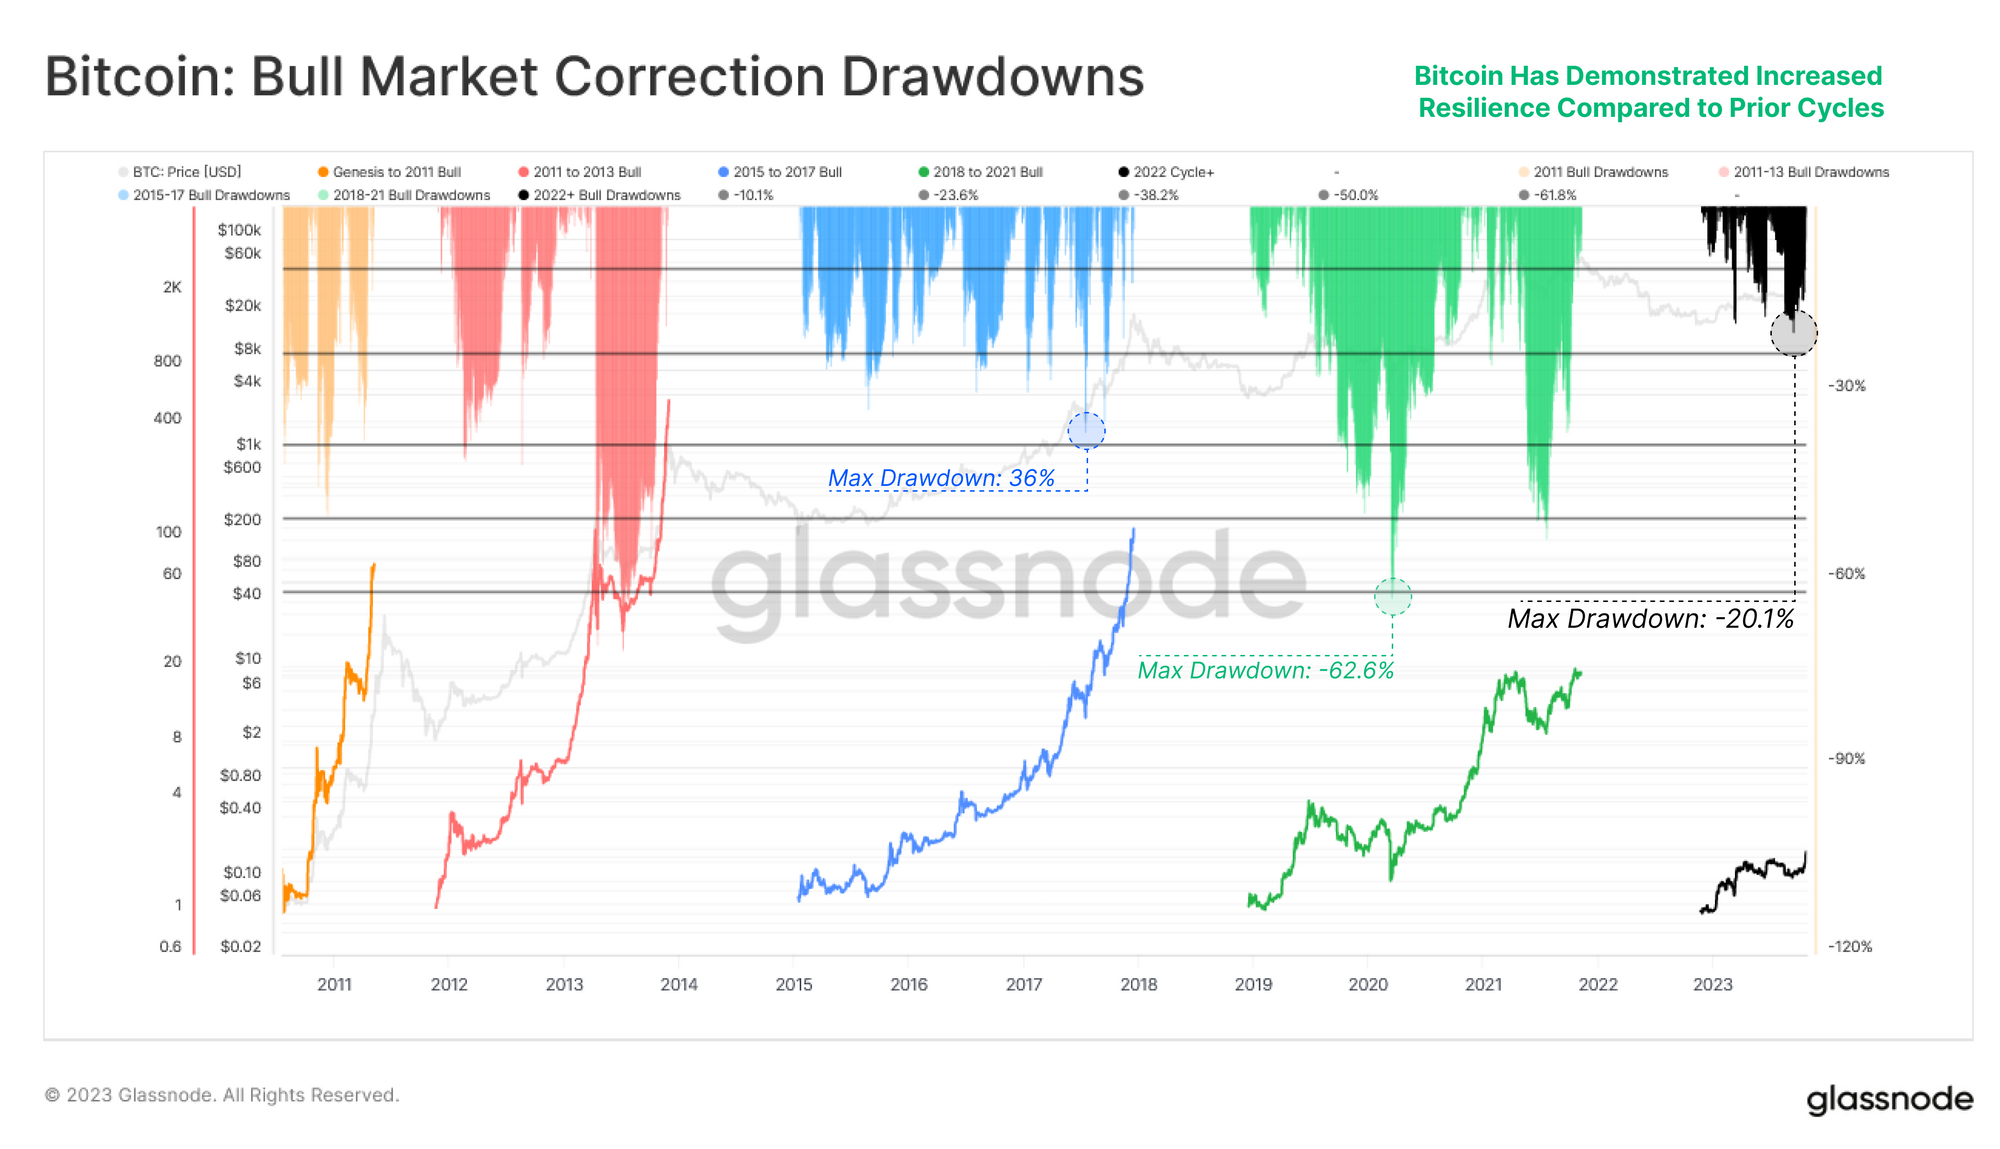
Comparable strength is visible for BTC, with the deepest correction in 2023 being just -20.1%. The 2016-17 bull market saw regular corrections exceeding -25%, whilst 2019 pulled back from the July-2019 high or $14k by over -62%.
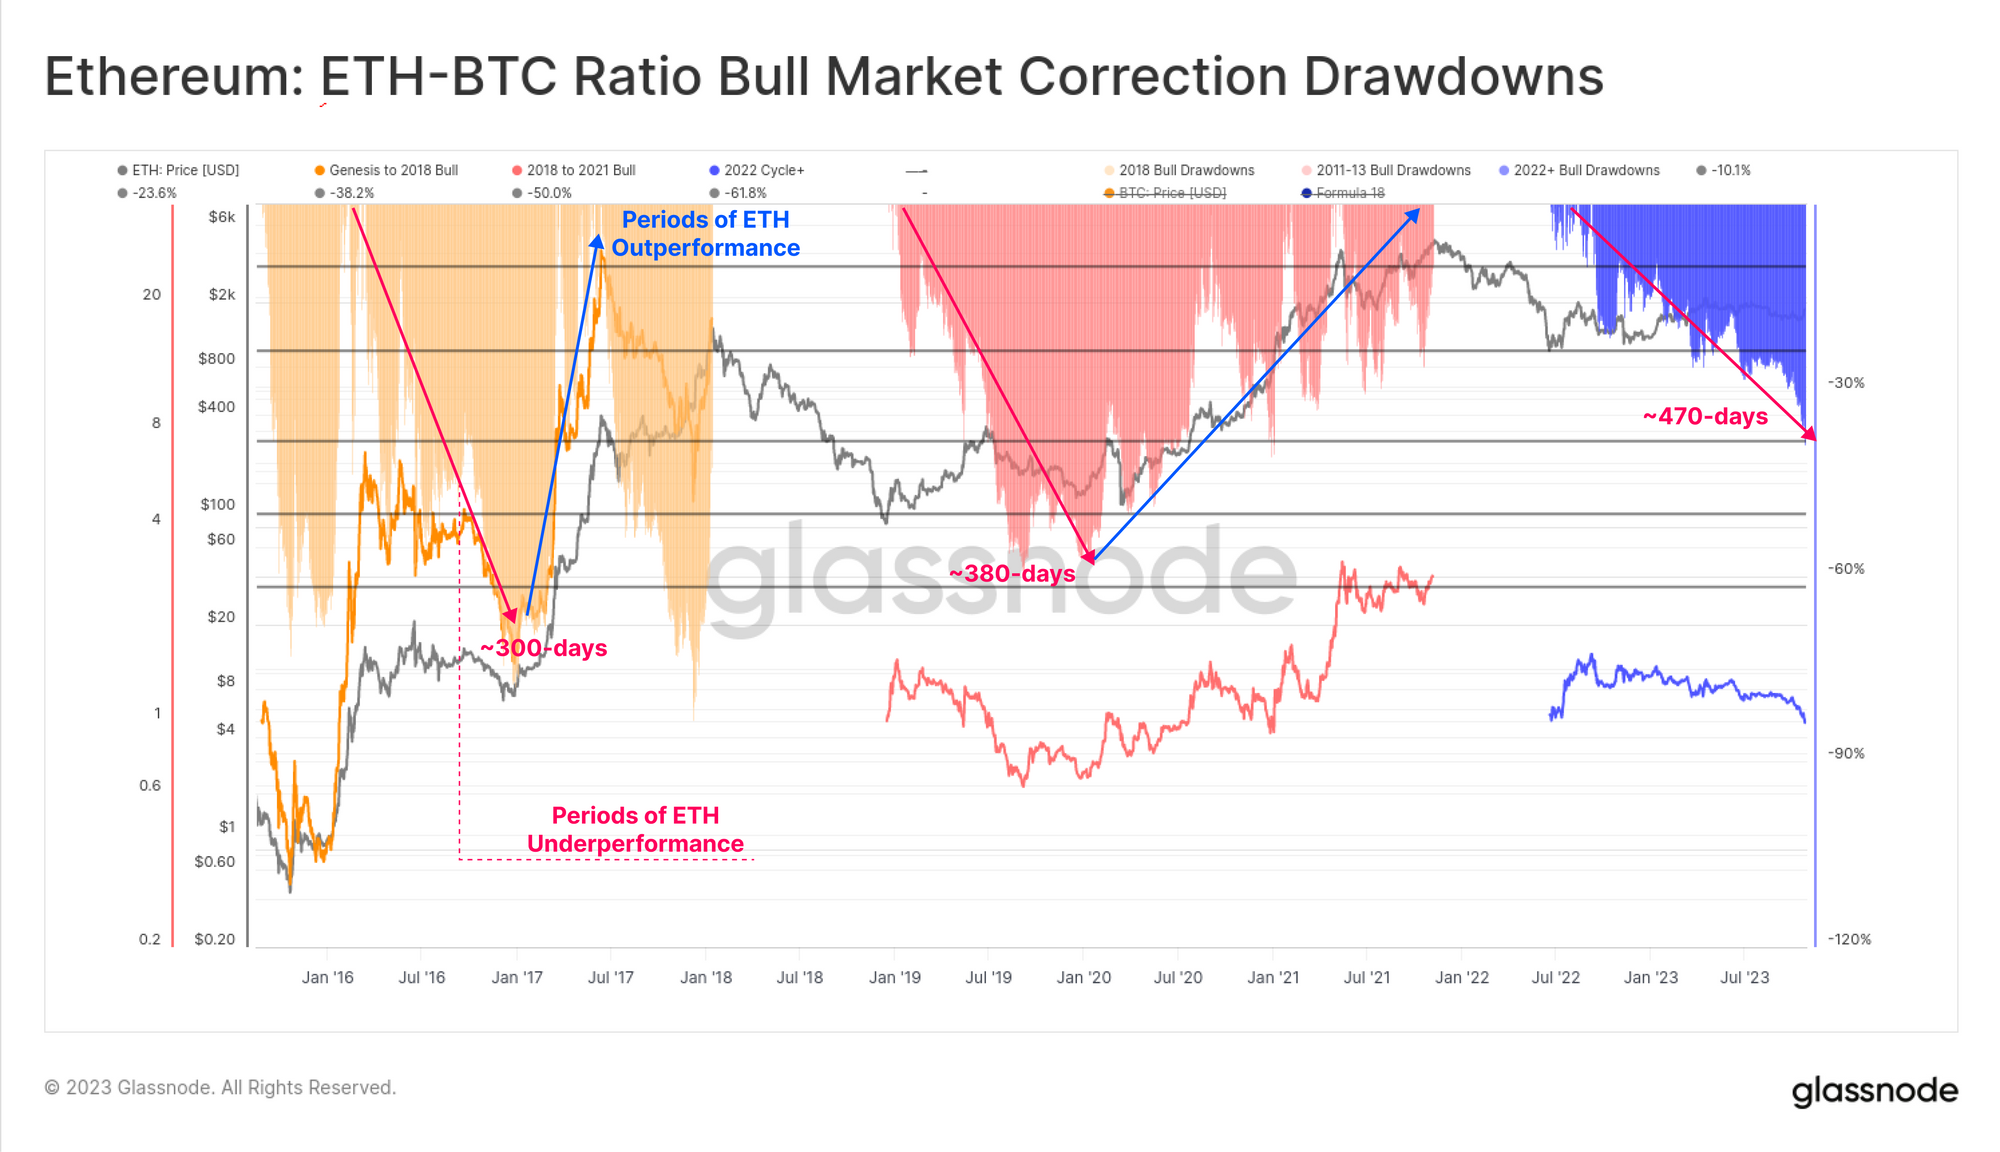
For assessing capital rotation within the digital asset market, a useful reference is to seek periods where ETH out-performs relative to BTC. The chart below shows the depth of the maximum drawdown of the ETH-BTC ratio, compared to the local high of the prevailing uptrend.
Prior cycles have seen ETH drawdown to depths of over -50% on a relative basis during the bear market recovery phase, with the current drawdown reaching -38%. Of particular interest is the duration of this trend, where ETH has depreciated against BTC for over 470-days thus far. This highlights an underlying trend between cycles, where BTC dominance increases over a longer duration in the hangover period after a bear market.
We can also use this tool to monitor for inflection points in the Risk-on vs Risk-off cycle that we touched on in WoC 41 (and will revisit later in this edition).
The chart provides another perspective on relative performance, showing oscillators for the rolling Quarterly, Weekly and Weekly ROI of the ETH/BTC Ratio. A barcode indicator (in blue) then highlights periods where all three timeframes are signalling under-performance of ETH relative to BTC.
Here we can see that the recent weakness in the ETH/BTC Ratio is similar to that seen in May-July 2022, with the price ratio having reached the same level of 0.052.

Trends in Investor Sentiment
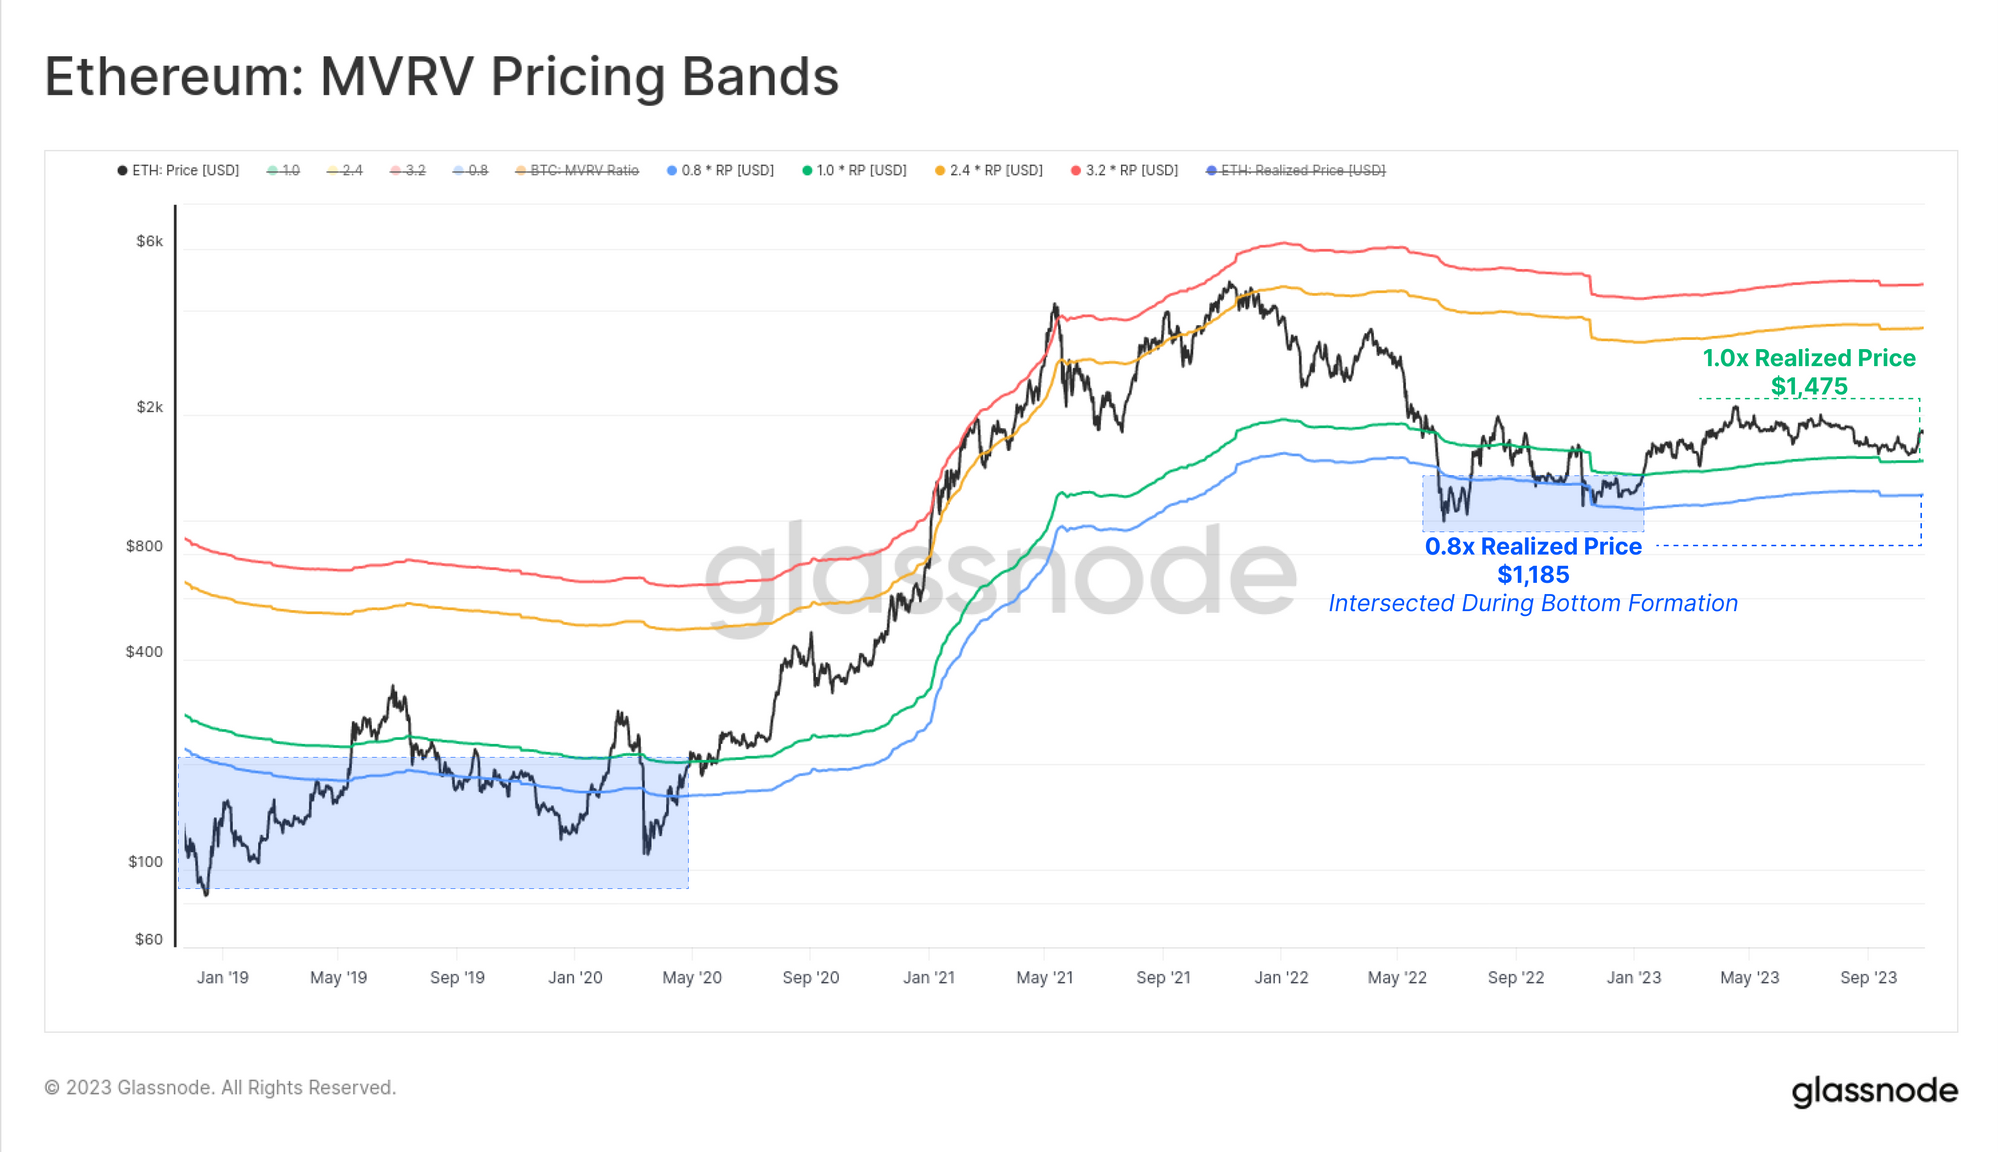
Diving deeper into Ethereum price models, we note that ETH is trading at $1,800, which is +22% above the Realized Price ($1,475). The Realized Price is often considered the average cost basis for all coins in the supply, priced at the time when they last transacted.
This suggests that the average ETH holder is holding a modest degree of profit, however it remains some distance below the extreme price levels often visited during bull market euphoria.
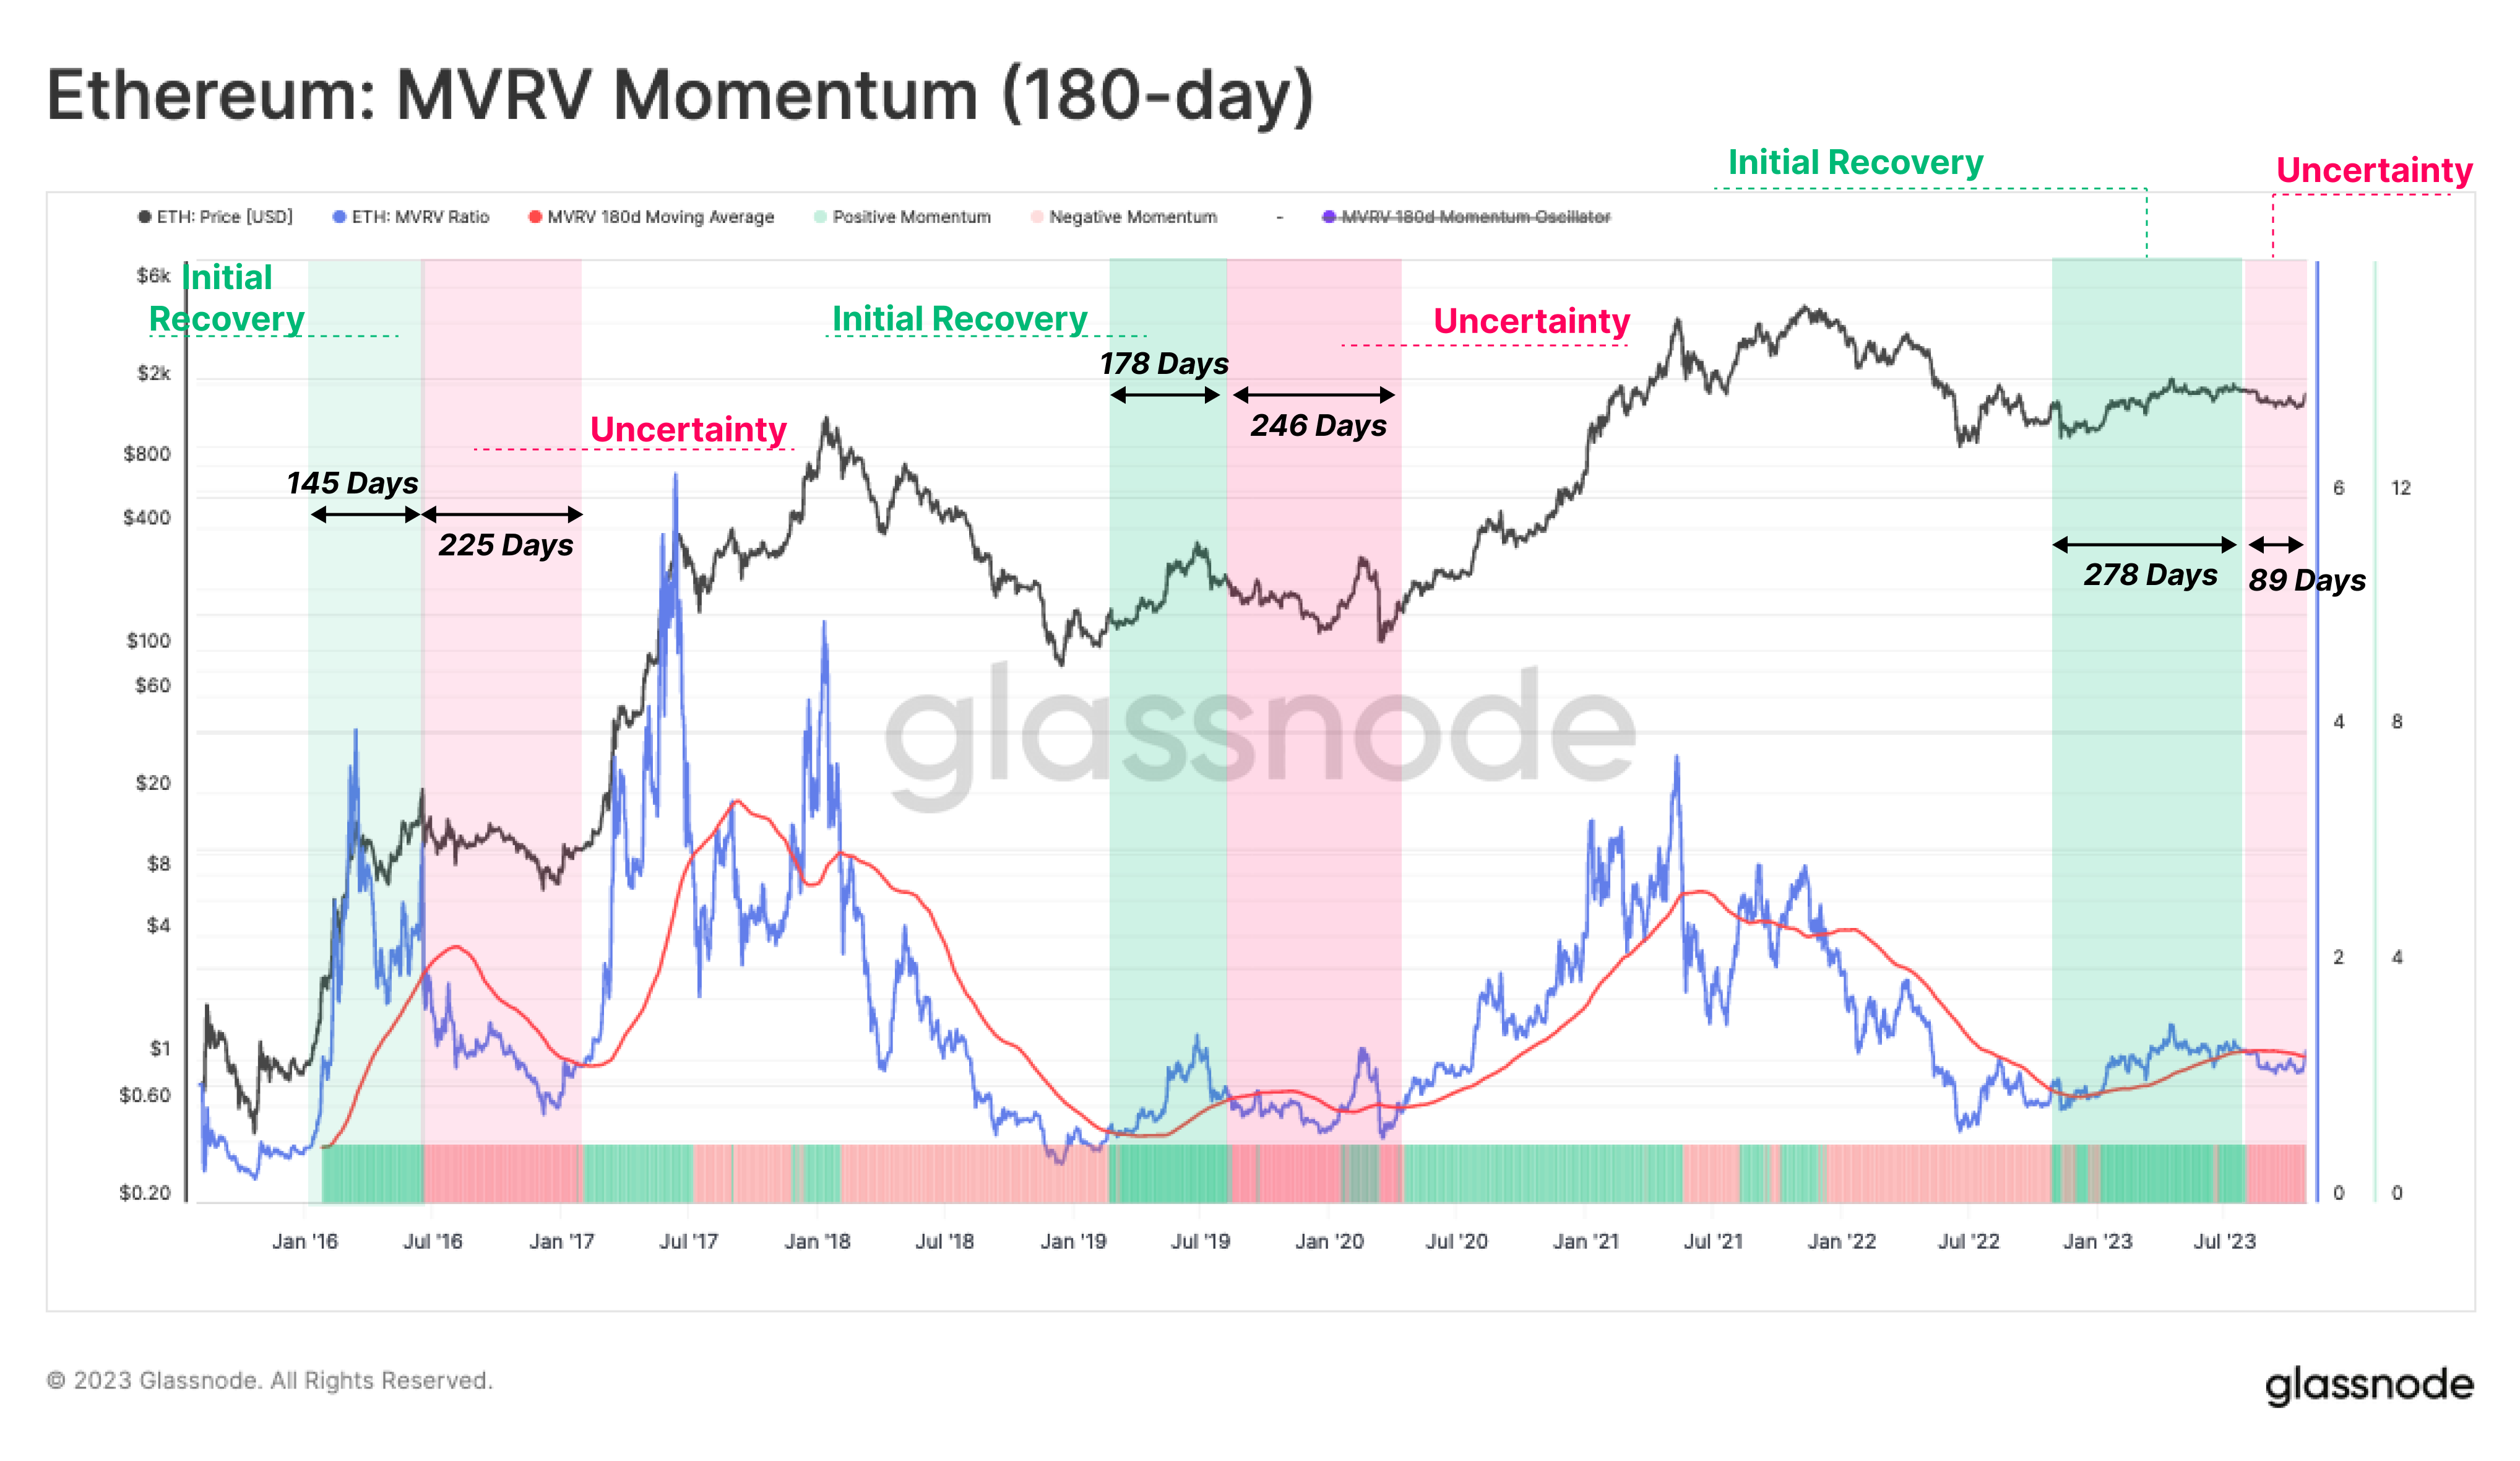
Another way to visualize shifts in investor profitability is via the MVRV Ratio, being the ratio between price and the Realized Price. In this instance, we compare the MVRV Ratio to its 180-day moving average as a tool to monitor trends.
Periods where the MVRV Ratio trades above this long-term mean indicate investor profitability is increasingly meaningfully, and is often a signal of a rising market. However, despite the positive market performance for ETH YTD, by this metric the market is still experiencing negative momentum. It seems that the hangover from the 2022 bear is still being slowly worked through.
Shifting Confidence
We can also leverage the relative performance of ETH investor profitability using the Investor Confidence in Trend indicator we developed in WoC 38. The aim is to gauge the tides of shifting sentiment for ethereum investors, constructed by looking at the deviation of the cost basis of two subgroups: holders and spenders.
- 🟥 Negative Sentiment is when the cost basis of spenders is significantly lower than holders.
- 🟩 Positive Sentiment is when the cost basis of the spenders is significantly higher than holders.
- 🟧 Transition Sentiment is when the cost basis fluctuates close to the holders cost basis.
By this measure, the market is within a transitional zone, being positive, but of a relatively small magnitude.

Altseason In USD...but not in BTC
Building on the prior work conducted in the WoC 41, we are able to produce a new iteration for the Altcoin Indicator. In this model, we utilize the previously defined risk-on environment as our first condition, requiring capital inflows into BTC, ETH and Stablecoins. We supplement this with a second condition, being a positive momentum within the Total Altcoin Cap (total crypto cap excluding BTC, ETH and Stablecoins).
Here we look for periods where the aggregate valuation of the Altcoin sector is greater than its 30D SMA. This indictaor flashed positive on 20-Oct, preceding the explosive Bitcoin move from $29.5k to $35.0k.

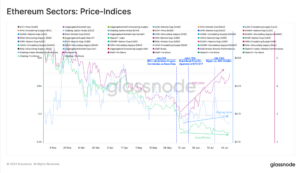
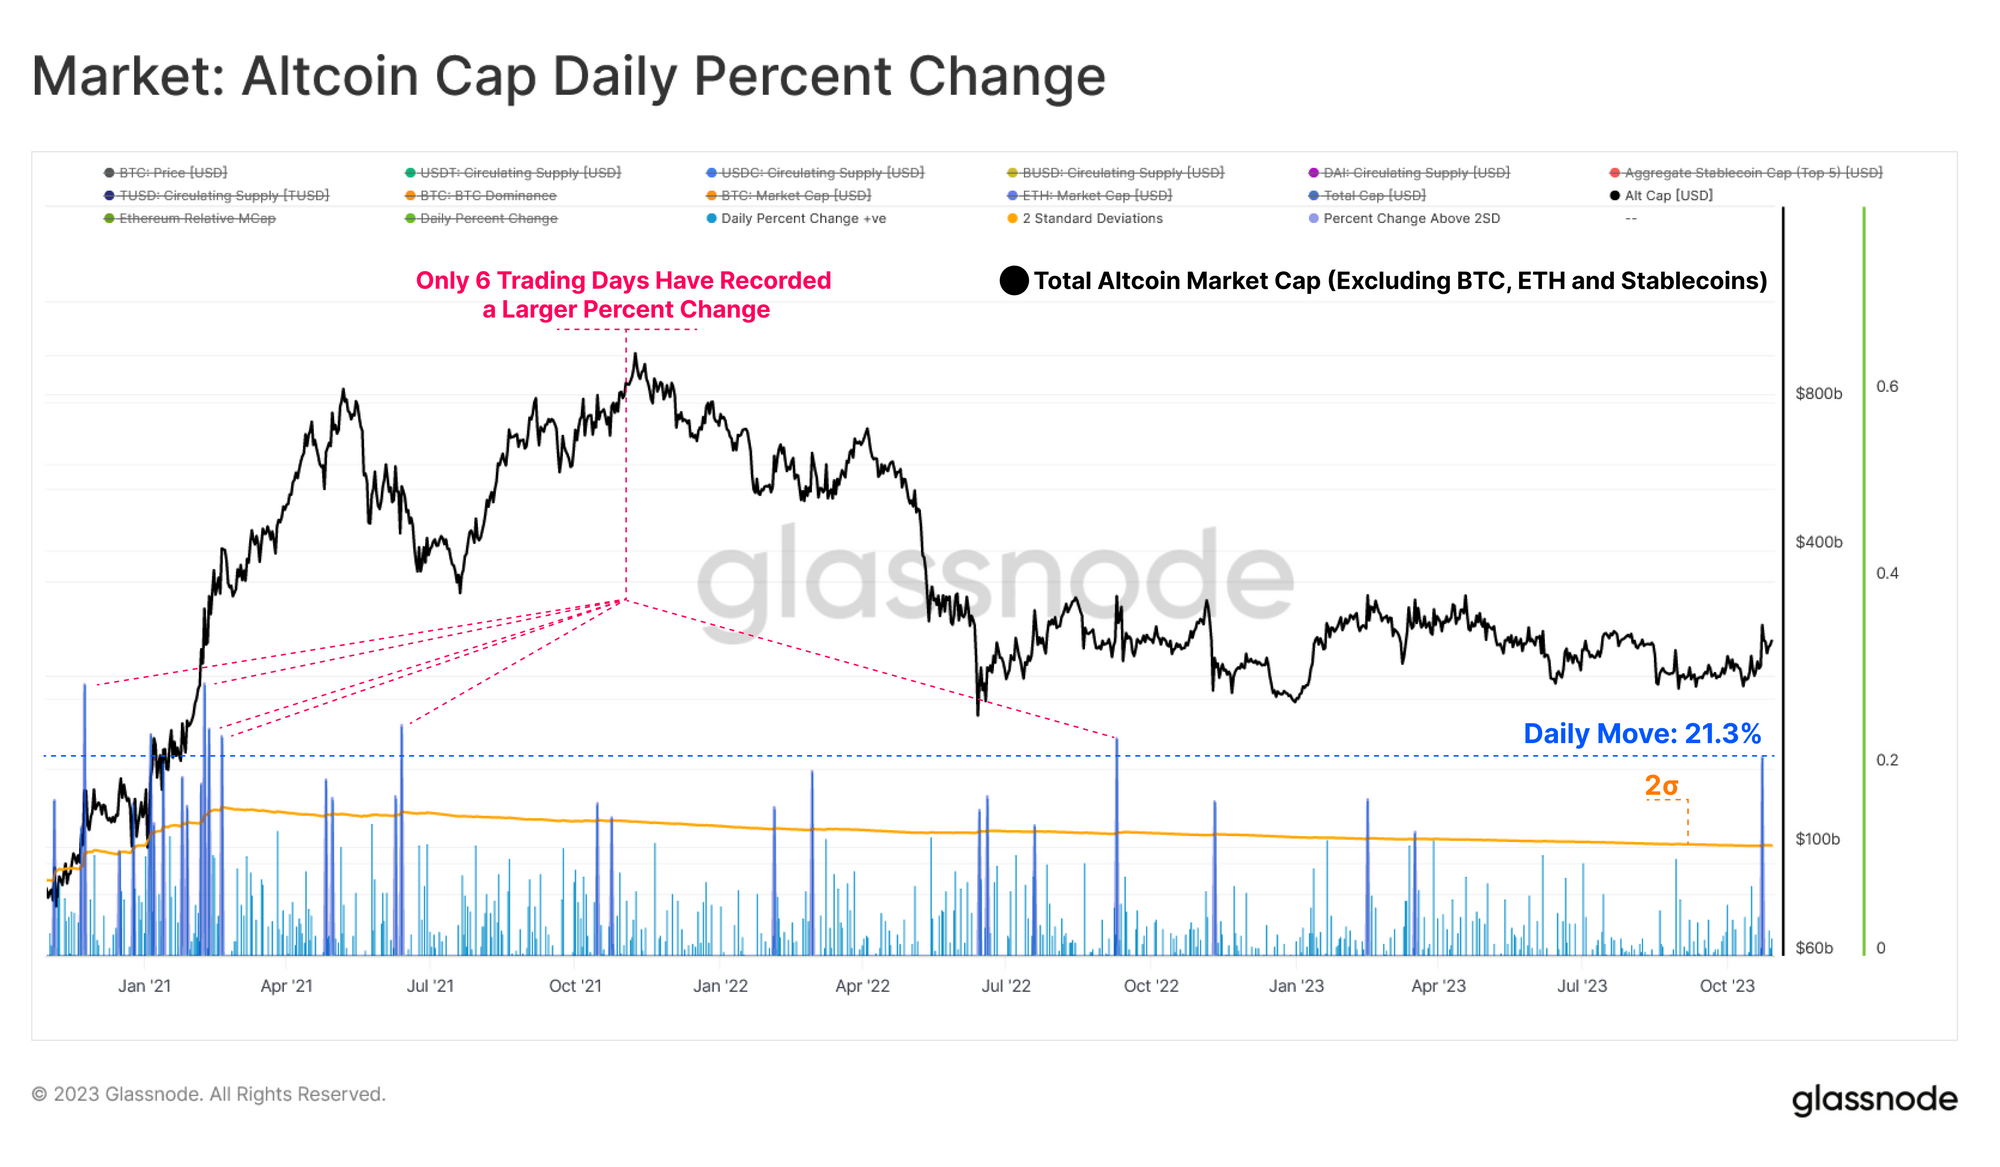
This heightened level of confidence in digital assets is apparent when assessing the recent performance of the Total Altcoin Market Cap.
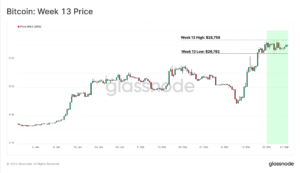
The local move upwards recorded a +21.3% increase in the sector valuation, with only six trading days registering a larger percentage change. This highlights a waterfall effect of investor capital, as rising Bitcoin dominance tends to inspire an uptick in altcoin valuations relative to fiat currencies.
However, it is important to recall that Bitcoin dominance is continuing to rise. On a relative basis, BTC now commands over 53% of the digital asset market valuation, with Ethereum, Altcoins at large, and stablecoins all seeing a relative decline in their dominance throughout 2023. Bitcoin dominance has increased from a cyclical low of 38% hit in late 2022.

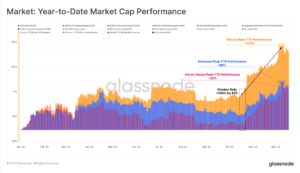
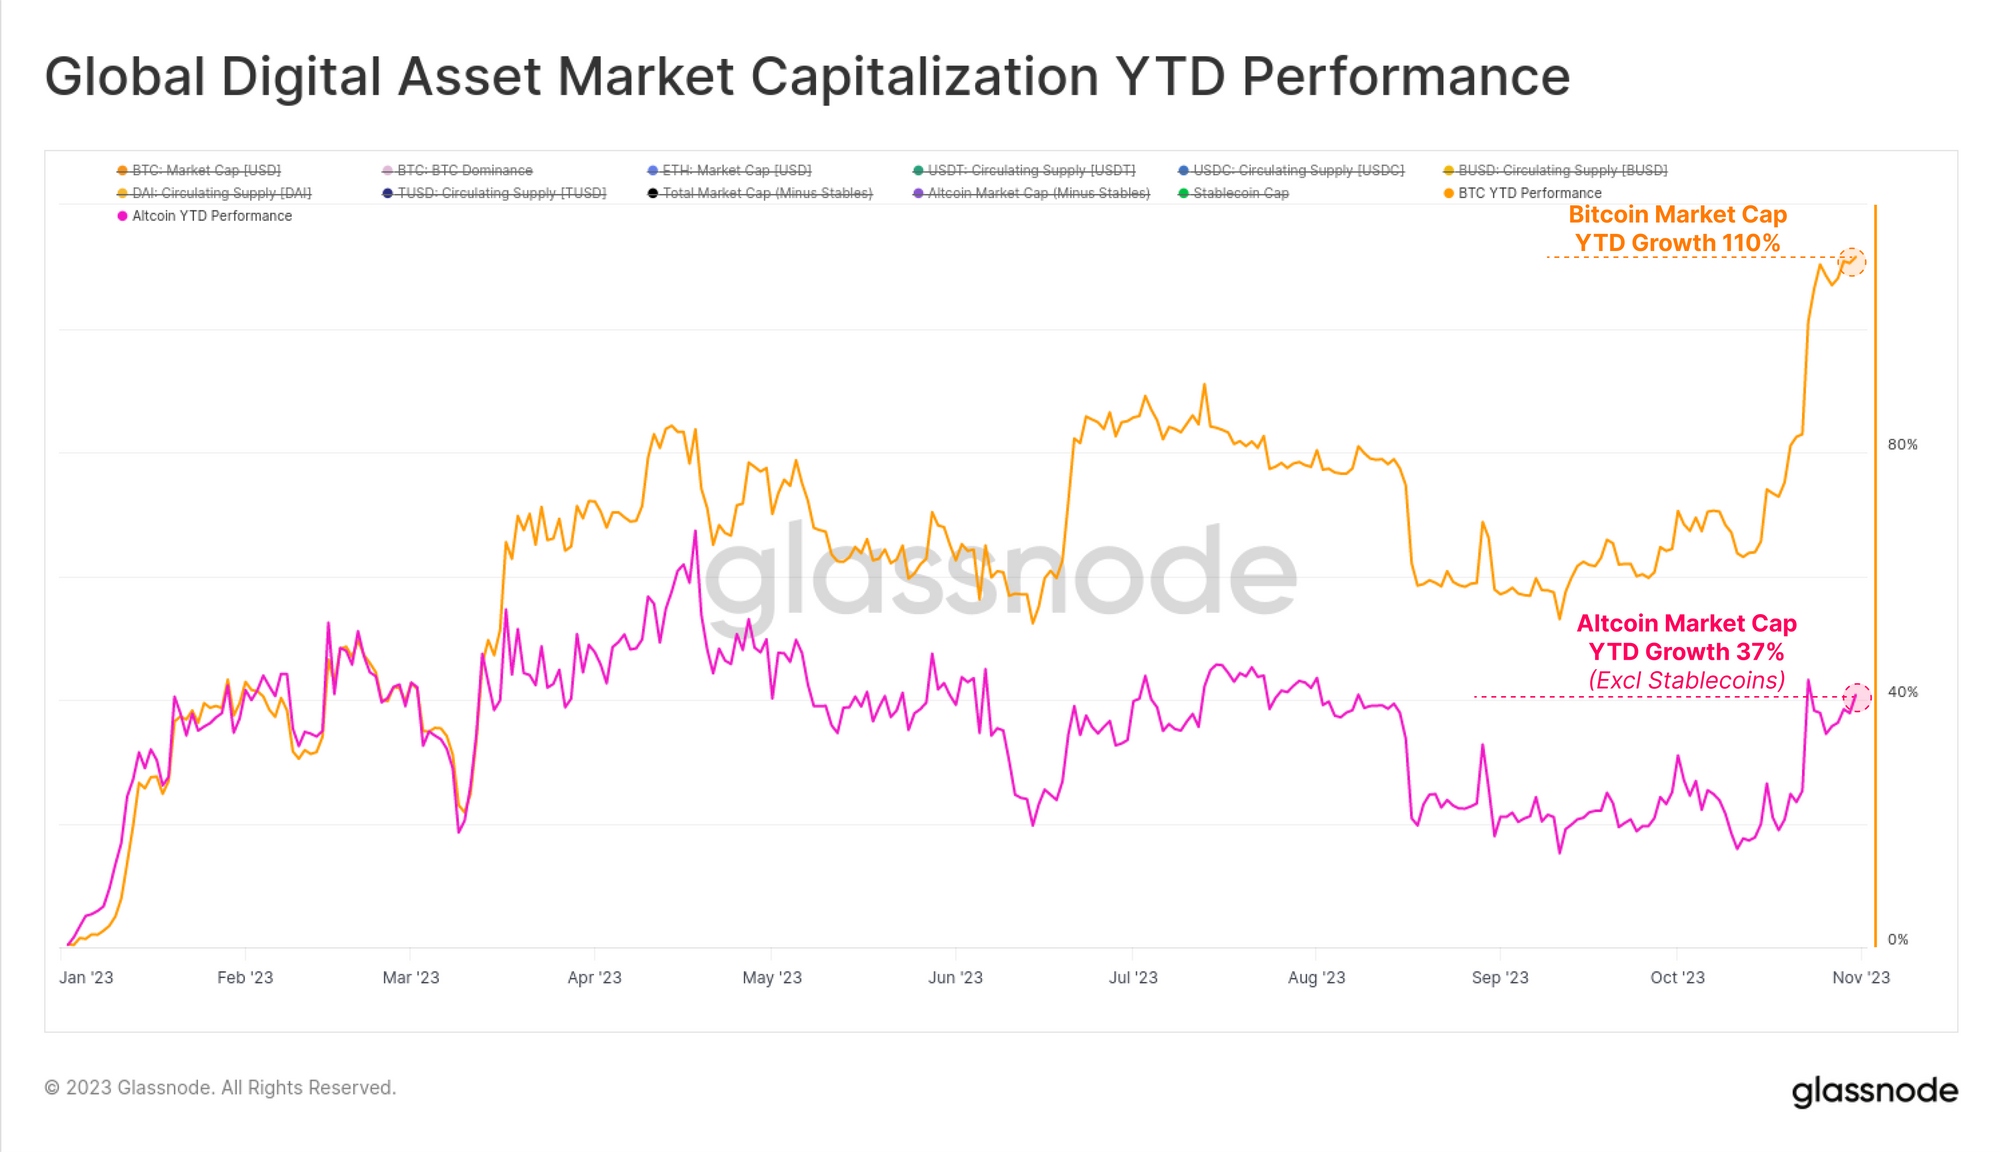
To close out this perspective, we can compare the YTD increase of the Bitcoin vs Aggregate Altcoin market cap (excl Stablecoins). Bitcoin's market cap has increased by 110% in 2023 compared to Altcoins rising by am impressive, but relatively small 37%.
This highlights an interesting market dynamic, whereby the altcoin sector are outperforming fiat currencies and traditional assets like Gold, but are meaningfully under-performing Bitcoin.
Conclusion and Summary
The digital asset market has posted impressive returns in 2023, leaving the initial recovery phase, and moving once again into an uptrend. Market corrections in 2023 for market leaders BTC and ETH have been significantly shallower than in prior cycle uptrends, suggesting a level of investor support and positive capital inflows are taking place.
Across several indicators, including our developing Altcoin Indicator, we have seen the first substantial increase in altcoin sector market valuations since the last cycle peak. However, it is important to note that this performance is measured relative to fiat currencies, namely the USD. Within the digital asset realm, Bitcoin dominance continues to rise, leading to the BTC market cap increasing by over 110% YTD.
Disclaimer: This report does not provide any investment advice. All data is provided for information and educational purposes only. No investment decision shall be based on the information provided here and you are solely responsible for your own investment decisions.

- SEO Powered Content & PR Distribution. Get Amplified Today.
- PlatoData.Network Vertical Generative Ai. Empower Yourself. Access Here.
- PlatoAiStream. Web3 Intelligence. Knowledge Amplified. Access Here.
- PlatoESG. Carbon, CleanTech, Energy, Environment, Solar, Waste Management. Access Here.
- PlatoHealth. Biotech and Clinical Trials Intelligence. Access Here.
- Source: https://insights.glassnode.com/the-week-onchain-week-44-2023/
- :has
- :is
- :not
- :where
- $UP
- 118
- 200
- 2000
- 2019
- 2022
- 2023
- 3AC
- a
- Able
- above
- advice
- After
- again
- against
- aggregate
- aim
- All
- also
- Altcoin
- Altcoins
- am
- amidst
- an
- and
- Another
- any
- apparent
- applications
- appreciation
- approval
- ARE
- AS
- assess
- Assessing
- asset
- Assets
- At
- average
- back
- based
- basis
- BE
- Bear
- Bear Market
- been
- being
- below
- Benchmark
- between
- Bitcoin
- bitcoin dominance
- Bitcoin ETF
- Black
- Blue
- Bonds
- both
- BTC
- BTC Dominance
- BTC market cap
- bull
- Bull Market
- but
- by
- CAN
- cap
- capital
- Celcius
- change
- Chart
- classes
- Close
- Coins
- Collapse
- comes
- Commodities
- compare
- compared
- condition
- conducted
- confidence
- Consider
- considered
- content
- context
- continues
- continuing
- Corrections
- correlated
- Cost
- cost basis
- crypto
- currencies
- Current
- cycle
- cycles
- Cyclical
- data
- Days
- decision
- decisions
- Decline
- deeper
- deepest
- defensive
- defined
- Degree
- demonstrating
- depth
- Depths
- Despite
- developed
- developing
- deviation
- digital
- Digital Asset
- Digital Assets
- directions
- distance
- does
- Dominance
- driven
- duration
- during
- dynamic
- edition
- educational
- effect
- embedded
- enables
- Environment
- Equities
- ETF
- ETH
- eth price
- ETH/USD
- ethereum
- Ethereum Price
- exceeds
- excluding
- experienced
- experiencing
- explore
- external
- extreme
- eye
- Failure
- far
- Fiat
- fiat currencies
- First
- flagged
- fluctuates
- following
- For
- from
- FTX
- gauge
- Glassnode
- Global
- Gold
- greater
- Have
- having
- heightened
- here
- High
- highlights
- Hit
- holder
- holders
- holding
- However
- HTTPS
- important
- impressive
- in
- Including
- Increase
- increased
- Increases
- increasing
- increasingly
- indicate
- Indicator
- Indicators
- Inflection
- inflows
- information
- initial
- inspire
- instance
- interest
- interesting
- internal
- into
- investment
- investor
- Investors
- IT
- iteration
- ITS
- june
- just
- large
- larger
- Last
- Late
- later
- leader
- leaders
- leading
- leaving
- Level
- levels
- Leverage
- like
- likely
- local
- long-term
- longer
- Look
- looking
- Low
- Macro
- Majors
- many
- Market
- Market Cap
- Market Leader
- market performance
- Market Valuations
- maximum
- mean
- meaningful
- measure
- measured
- Metals
- metric
- model
- models
- modest
- Momentum
- Monitor
- move
- moves
- moving
- moving average
- MVRV
- MVRV ratio
- namely
- negative
- New
- no
- note
- now
- observed
- of
- often
- on
- On-Chain
- once
- only
- or
- our
- out
- outperforming
- over
- own
- part
- particular
- Peak
- percentage
- performance
- period
- periods
- perspective
- phase
- Place
- plato
- Plato Data Intelligence
- PlatoData
- Play
- points
- positive
- posted
- Precious
- Precious Metals
- previous
- previously
- price
- Prices
- Prior
- produce
- Profit
- profitability
- Progress
- provide
- provided
- provides
- purposes
- ratio
- reached
- reaching
- realized
- realized price
- realm
- recent
- recorded
- recovery
- reference
- registering
- regular
- related
- relative
- relatively
- remains
- report
- respectively
- responsible
- returns
- Rise
- rising
- ROI
- Rolling
- s
- same
- saw
- SEC
- Second
- sector
- see
- seeing
- Seek
- seems
- seen
- sentiment
- set
- several
- SHIFTING
- Shifts
- showing
- Shows
- Signal
- significantly
- similar
- since
- Sitting
- SIX
- Slowly
- SMA
- small
- smaller
- solely
- some
- Stablecoins
- Still
- store
- store of value
- strength
- strong
- stronger
- substantial
- substantially
- such
- Suggests
- supplement
- supply
- support
- taking
- tends
- terms
- than
- that
- The
- The Capital
- the information
- The Week On-Chain
- their
- then
- they
- this
- three
- Through
- throughout
- Thus
- tides
- tightly
- time
- to
- today
- tool
- Total
- touched
- trades
- Trading
- traditional
- Trend
- Trends
- two
- Uncertainty
- underlying
- uptrend
- upwards
- us
- USD
- use
- using
- utilize
- Valuation
- Valuations
- value
- various
- via
- visible
- visited
- visualize
- Volatility
- vs
- Way..
- we
- weakness
- week
- weekly
- Weeks
- when
- which
- Whilst
- will
- with
- within
- Work
- worked
- you
- Your
- youtube
- zephyrnet