BNB price started a fresh decline from $320 resistance zone. The price is now retesting the $290 support and is at risk of more downsides.
- BNB price is gaining bearish momentum from the $320 resistance.
- The price is now trading below $310 and the 100 simple moving average (4 hours).
- There was a break below a key bullish trend line with support at $315 on the 4-hour chart of the BNB/USD pair (data source from Binance).
- The pair might continue to move down if it fails to stay above the $290 support.
BNB Price Takes Hit
In the past few days, BNB price made more than three attempts to clear the $320 resistance zone. However, the bears remained active and protected more gains.
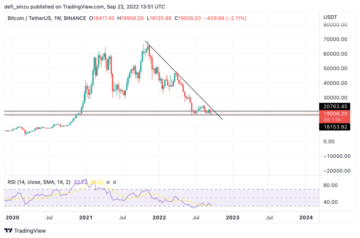
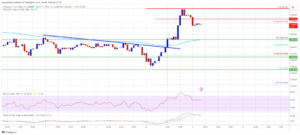
As a result, there was a bearish reaction below the $315 level, like Bitcoin and Ethereum. There was a break below a key bullish trend line with support at $315 on the 4-hour chart of the BNB/USD pair. The pair even declined below the $300 level and tested the key support at $290.
A low is formed near $290.3, and the price is now struggling to correct higher. BNB price is now trading below $310 and the 100 simple moving average (4 hours). Immediate resistance is near the $298 level or the 23.6% Fib retracement level of the recent decline from the $320 swing high to the $290 low.
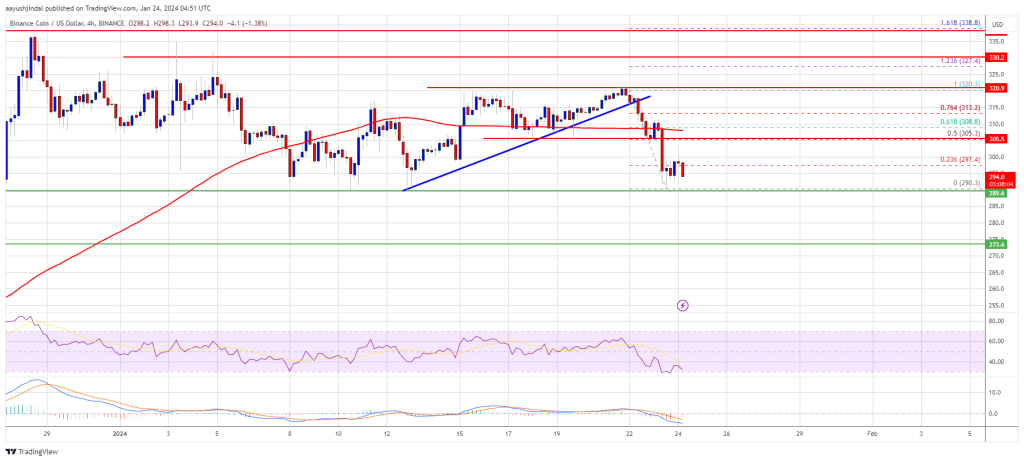
Source: BNBUSD on TradingView.com
The next resistance sits near the $305 level. It is close to the 50% Fib retracement level of the recent decline from the $320 swing high to the $290 low. A clear move above the $305 zone could send the price further higher. In the stated case, BNB price could test $320. A close above the $320 resistance might set the pace for a larger increase toward the $335 resistance. Any more gains might call for a test of the $350 level.
More Downsides?
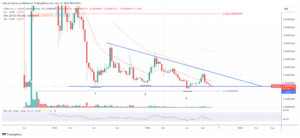
If BNB fails to clear the $305 resistance, it could continue to move down. Initial support on the downside is near the $290 level.
The next major support is near the $285 level. The main support sits at $272. If there is a downside break below the $272 support, the price could drop toward the $250 support. Any more losses could initiate a larger decline toward the $220 level.
Technical Indicators
4-Hours MACD – The MACD for BNB/USD is gaining pace in the bearish zone.
4-Hours RSI (Relative Strength Index) – The RSI for BNB/USD is currently below the 50 level.
Major Support Levels – $290, $285, and $272.
Major Resistance Levels – $298, $305, and $320.
Disclaimer: The article is provided for educational purposes only. It does not represent the opinions of NewsBTC on whether to buy, sell or hold any investments and naturally investing carries risks. You are advised to conduct your own research before making any investment decisions. Use information provided on this website entirely at your own risk.
- SEO Powered Content & PR Distribution. Get Amplified Today.
- PlatoData.Network Vertical Generative Ai. Empower Yourself. Access Here.
- PlatoAiStream. Web3 Intelligence. Knowledge Amplified. Access Here.
- PlatoESG. Carbon, CleanTech, Energy, Environment, Solar, Waste Management. Access Here.
- PlatoHealth. Biotech and Clinical Trials Intelligence. Access Here.
- Source: https://www.newsbtc.com/analysis/bnb/bnb-price-could-see-major-drawdown-290/
- :is
- :not
- 1
- 100
- 23
- 50
- a
- above
- active
- advised
- and
- any
- ARE
- article
- At
- Attempts
- average
- bearish
- Bearish Momentum
- Bears
- before
- below
- binance
- bnb
- BNB Price
- BNB/USD
- Break
- Bullish
- buy
- call
- case
- Chart
- clear
- Close
- Conduct
- continue
- correct
- could
- Currently
- data
- Days
- decisions
- Decline
- does
- down
- downside
- downsides
- Drop
- educational
- entirely
- Even
- fails
- few
- For
- formed
- fresh
- from
- further
- gaining
- Gains
- High
- higher
- hold
- HOURS
- However
- HTTPS
- if
- immediate
- in
- Increase
- index
- information
- initial
- initiate
- investing
- investment
- Investments
- IT
- Key
- larger
- Level
- levels
- like
- Line
- losses
- Low
- MACD
- made
- Main
- major
- Making
- max-width
- might
- Momentum
- more
- move
- moving
- moving average
- Near
- NewsBTC
- next
- now
- of
- on
- only
- Opinions
- or
- own
- Pace
- pair
- past
- plato
- Plato Data Intelligence
- PlatoData
- price
- protected
- provided
- purposes
- reaction
- recent
- relative
- relative strength index
- remained
- represent
- research
- Resistance
- result
- retracement
- Risk
- risks
- rsi
- see
- sell
- send
- set
- Simple
- sits
- Source
- started
- stated
- stay
- strength
- Struggling
- support
- support levels
- Swing
- takes
- test
- tested
- than
- The
- There.
- this
- three
- to
- toward
- Trading
- TradingView
- Trend
- use
- was
- Website
- whether
- with
- you
- Your
- zephyrnet