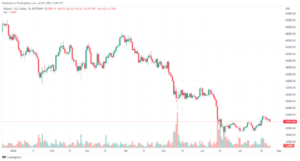
Shiba Inu (SHIB) is in a crucial make-or-break moment. Following a market-wide altcoin slump, SHIB’s price action is being shaped by two opposing chart patterns, both of which could have significant implications for the price’s future.
A Tale Of Two Patterns For Shiba Inu
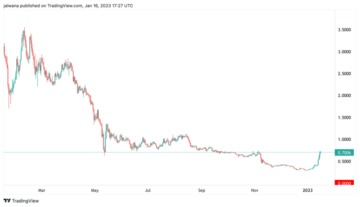
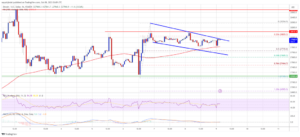
The 1-week chart for SHIB reveals a tale of two patterns. On one hand, there’s the bullish triple bottom, suggesting a potential end to SHIB’s two-year downtrend. On the other, a descending triangle, which has been in the making for over 13 months, hints at a bearish outcome. In an analysis on August 30, NewsBTC already warned of this scenario.
Yesterday, SHIB’s price dipped to a low of $0.00000697 before rebounding slightly to $0.00000722. This places it precariously above the crucial support line of $0.00000715. For SHIB to steer clear of the bearish implications of the descending triangle and to validate the triple bottom, it’s imperative that it maintains a weekly close above this price.
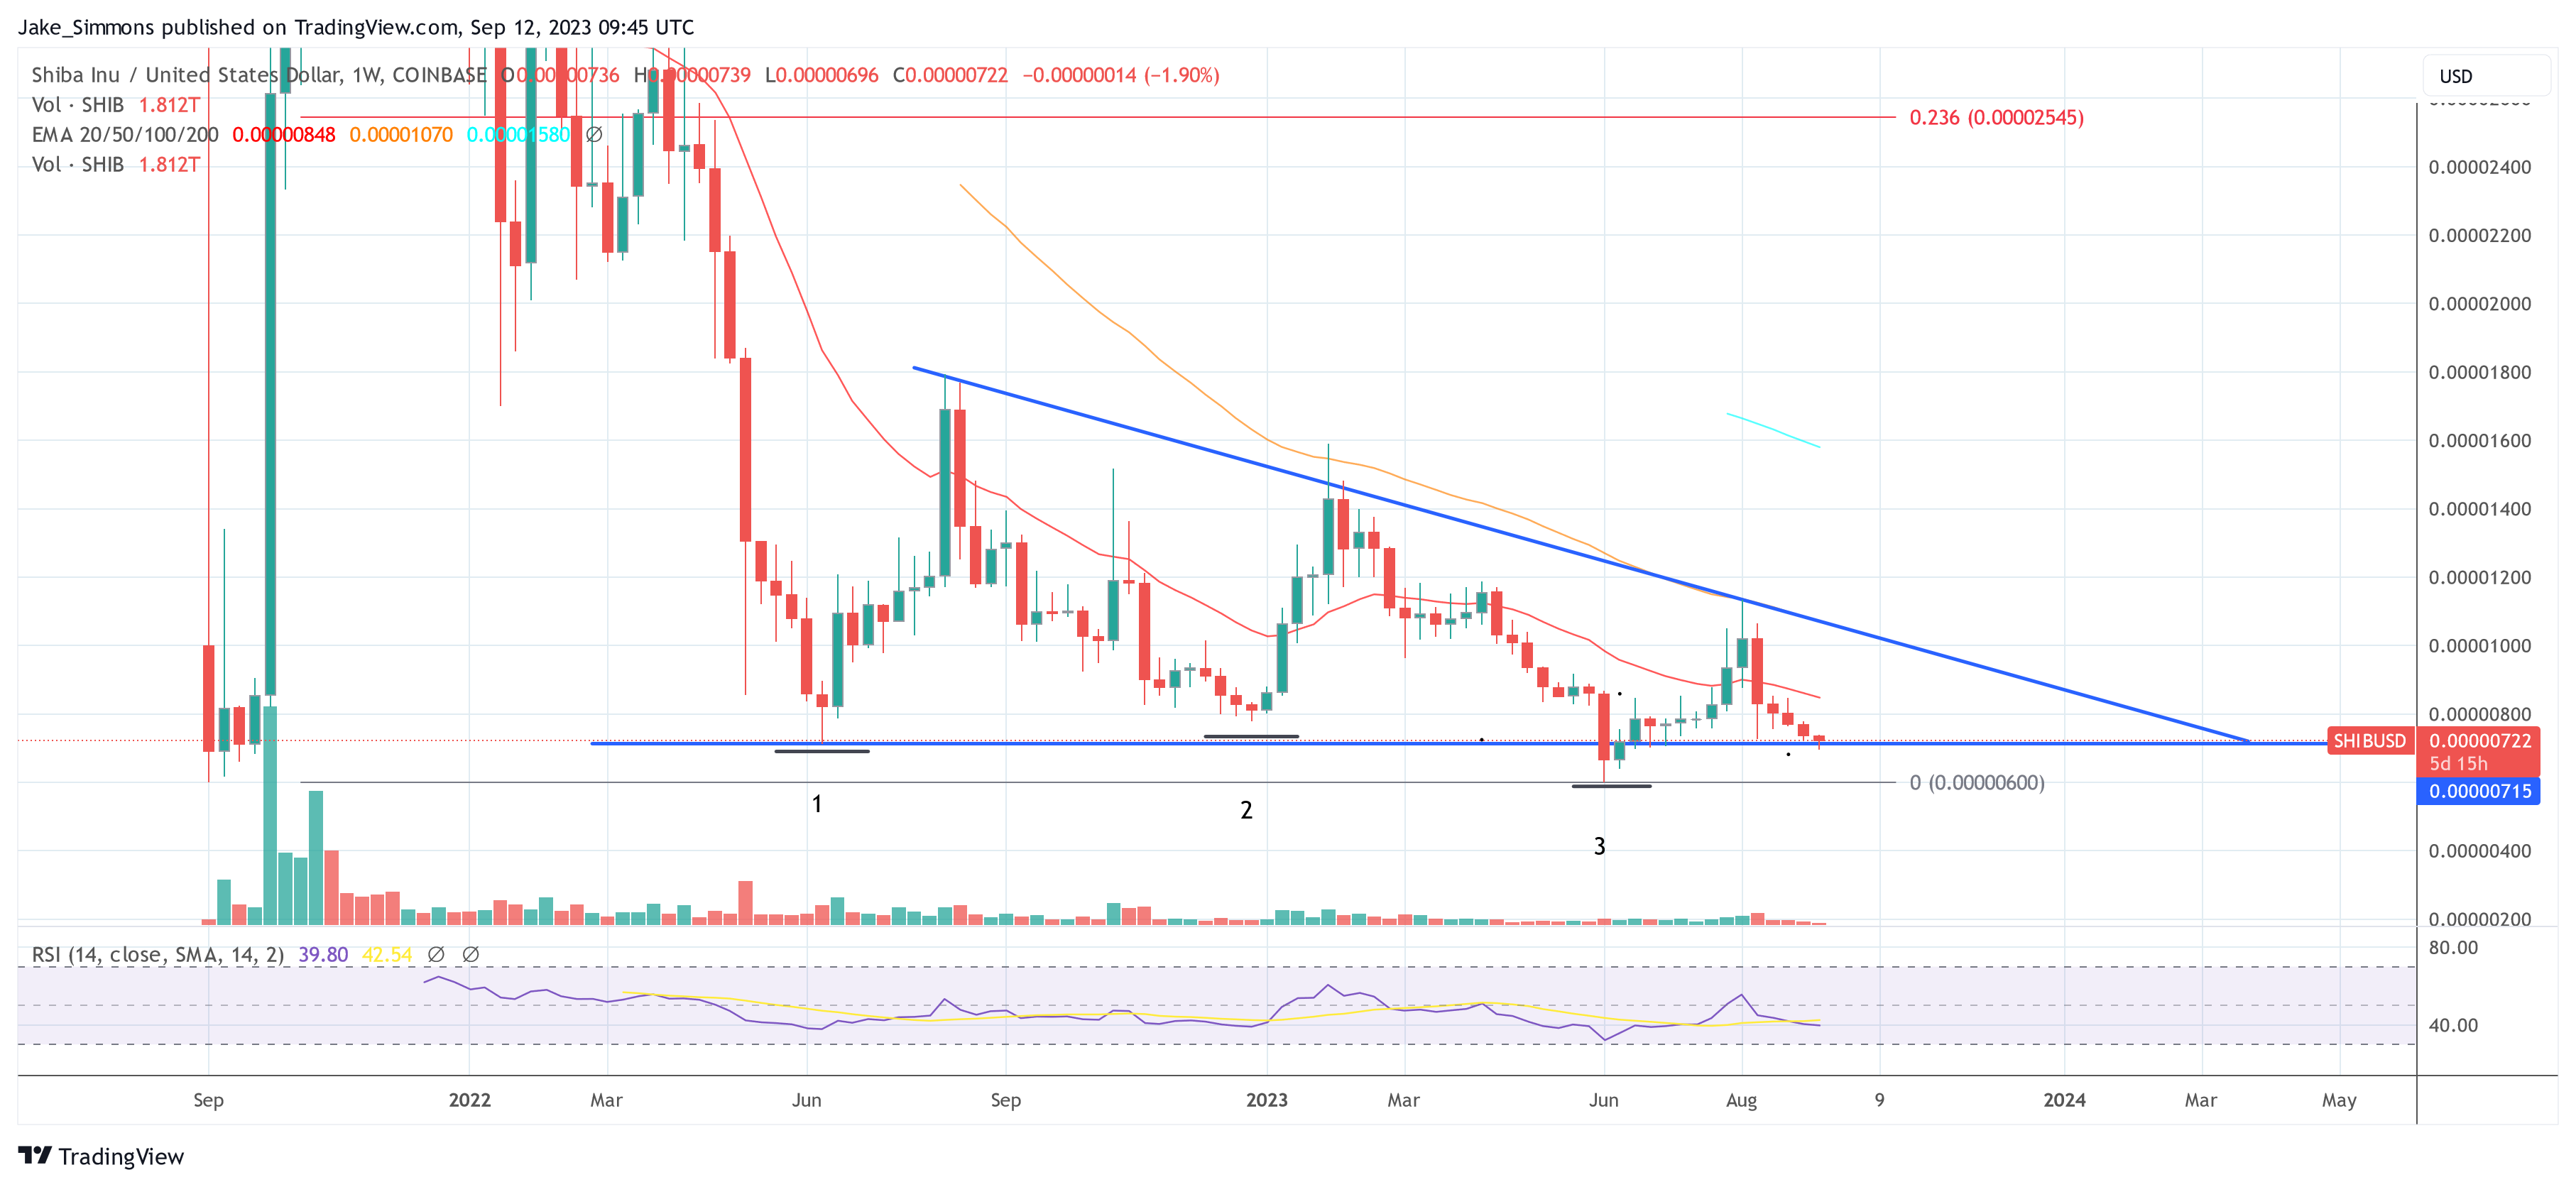
The triple bottom, a bullish chart pattern, is characterized by three roughly equivalent lows bouncing off a support level, culminating in a breakout above resistance. This suggests a shift in momentum from sellers to buyers. For SHIB, the criteria for a triple bottom seem to be in place: an existing downward trend precedes the pattern; the three lows are approximately equal, allowing for a horizontal trend line and a decline in volume throughout the pattern suggests weakening bearish momentum.
SHIB’s journey through this pattern began in June 2022 with its first low at $0.00000715. After a brief recovery, it hit its second low in December 2021 at $0.00000781. The third and most recent low was recorded in June 2023 at $0.0000060.
The Shadow Of The Descending Triangle
However, the triple bottom’s bullish narrative is challenged by the descending triangle’s bearish undertones. If SHIB’s price falls below the $0.00000715 support, it could validate the descending triangle, potentially pushing SHIB towards its year-to-date low of $0.000006. A breach of this level might plunge SHIB into uncharted waters, making a new all-time low a grim possibility.
Traders often seek additional confirmation of patterns through other technical indicators. The Relative Strength Index (RSI) is one such tool. SHIB’s weekly RSI currently stands at a neutral 39.8 (neutral). However, a recent dip below the 30-mark (indicating oversold conditions) suggests that the recent price drop might have been the last for SHIB.
Should the triple bottom be validated, SHIB could witness a significant rally. An immediate target to watch would be the 23.6% Fibonacci retracement level at $0.00002545, translating to a potential surge of approximately 250% from its current price.
In conclusion, SHIB’s future hangs in the balance. The coming days and weeks will be crucial in determining whether it embarks on a bullish rally or succumbs to bearish pressures.
Featured image from Trader 2.0, chart from TradingView.com
- SEO Powered Content & PR Distribution. Get Amplified Today.
- PlatoData.Network Vertical Generative Ai. Empower Yourself. Access Here.
- PlatoAiStream. Web3 Intelligence. Knowledge Amplified. Access Here.
- PlatoESG. Automotive / EVs, Carbon, CleanTech, Energy, Environment, Solar, Waste Management. Access Here.
- PlatoHealth. Biotech and Clinical Trials Intelligence. Access Here.
- ChartPrime. Elevate your Trading Game with ChartPrime. Access Here.
- BlockOffsets. Modernizing Environmental Offset Ownership. Access Here.
- Source: https://www.newsbtc.com/shiba-inu/shiba-inu-make-or-break-price-250-rally-all-time-low/
- :has
- :is
- 1
- 13
- 2021
- 2022
- 2023
- 23
- 30
- 39
- 8
- a
- above
- Action
- Additional
- After
- all-time low
- Allowing
- already
- Altcoin
- an
- and
- approximately
- ARE
- At
- AUGUST
- Balance
- BE
- bearish
- Bearish Momentum
- been
- before
- began
- being
- below
- both
- Bottom
- breach
- breakout
- Bullish
- buyers
- by
- challenged
- characterized
- Chart
- clear
- Close
- coming
- conclusion
- conditions
- confirmation
- could
- criteria
- crucial
- culminating
- Current
- Currently
- Days
- December
- december 2021
- Decline
- descending triangle
- determining
- Dip
- downward
- Drop
- end
- equal
- Equivalent
- existing
- Falls
- Fibonacci
- First
- following
- For
- from
- future
- grim
- hand
- Have
- hints
- Hit
- Hits
- Horizontal
- However
- HTTPS
- if
- image
- immediate
- imperative
- implications
- in
- index
- indicating
- Indicators
- into
- Inu
- IT
- ITS
- journey
- june
- Last
- Level
- Line
- Low
- Lows
- maintains
- Making
- max-width
- might
- moment
- Momentum
- months
- most
- NARRATIVE
- Neutral
- New
- NewsBTC
- of
- off
- often
- on
- ONE
- or
- Other
- Outcome
- over
- Pattern
- patterns
- Place
- Places
- plato
- Plato Data Intelligence
- PlatoData
- plunge
- possibility
- potential
- potentially
- price
- PRICE ACTION
- Pushing
- rally
- recent
- recorded
- recovery
- relative
- relative strength index
- Relative Strength Index (RSI)
- Resistance
- retracement
- Reveals
- roughly
- rsi
- scenario
- Second
- Seek
- seem
- Sellers
- Shadow
- shaped
- SHIB
- Shiba
- Shiba Inu
- Shiba Inu Price
- shift
- significant
- Slump
- Source
- stands
- strength
- such
- Suggests
- support
- support level
- surge
- tale
- Target
- Technical
- that
- The
- Third
- this
- three
- Through
- throughout
- to
- tool
- towards
- trader
- trades
- TradingView
- Trend
- Triple
- two
- uncharted
- VALIDATE
- validated
- volume
- was
- Watch
- Waters
- weekly
- Weeks
- whether
- which
- will
- with
- witness
- would
- zephyrnet