Bitcoin price is moving lower from the $30,200 zone. BTC is signaling a fresh decline and there is a risk of a drop toward the $28,500 support.
- Bitcoin is struggling to remain in a positive zone above $29,200.
- The price is trading below $29,500 and the 100 hourly Simple moving average.
- There is a connecting bearish trend line forming with resistance near $29,450 on the hourly chart of the BTC/USD pair (data feed from Kraken).
- The pair could continue to move down if it breaks the $29,200 support zone.
Bitcoin Price Trims Gains
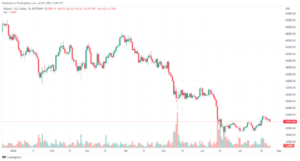
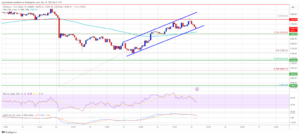
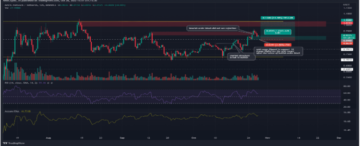
Bitcoin price faced another rejection above the $30,000 resistance zone. A high was formed near $30,190 and BTC reacted to the downside. There was a move below the $30,000 and $29,800 levels.
The price declined below the 50% Fib retracement level of the key increase from the $28,628 swing low to the $30,190 high. It seems like the bulls are now putting up some fight near the $29,300 zone. Bitcoin is now trading below $29,500 and the 100 hourly Simple moving average.
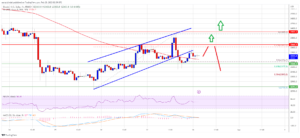
There is also a connecting bearish trend line forming with resistance near $29,450 on the hourly chart of the BTC/USD pair. If there is a fresh increase, the pair could face resistance near the 100 hourly Simple moving average at $29,400.
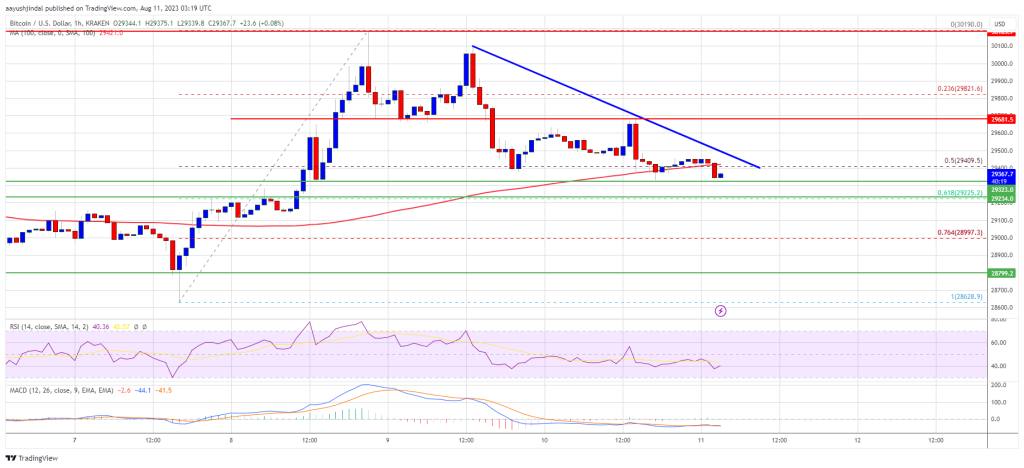
Source: BTCUSD on TradingView.com
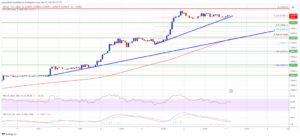
The next major resistance is near the trend line and $29,500. A close above the trend line could start a decent increase toward $30,000. To spark a steady uptrend, the price must settle above the $30,000 resistance. In the stated case, the price could rise toward $31,200 or even $32,000 in the coming days.
More Losses In BTC?
If Bitcoin fails to clear the $29,500 resistance, it could continue to move down. Immediate support on the downside is near the $29,320 level.
The next major support is near the $29,220 level or the 61.8% Fib retracement level of the key increase from the $28,628 swing low to the $30,190 high. A downside break below the $29,220 level might spark bearish moves. In the stated case, the price could revisit $29,000. Any more losses might call for a move toward the $28,500 level in the near term.
Technical indicators:
Hourly MACD – The MACD is now gaining pace in the bearish zone.
Hourly RSI (Relative Strength Index) – The RSI for BTC/USD is now below the 50 level.
Major Support Levels – $29,220, followed by $29,000.
Major Resistance Levels – $29,400, $29,500, and $30,000.
- SEO Powered Content & PR Distribution. Get Amplified Today.
- PlatoData.Network Vertical Generative Ai. Empower Yourself. Access Here.
- PlatoAiStream. Web3 Intelligence. Knowledge Amplified. Access Here.
- PlatoESG. Automotive / EVs, Carbon, CleanTech, Energy, Environment, Solar, Waste Management. Access Here.
- PlatoHealth. Biotech and Clinical Trials Intelligence. Access Here.
- ChartPrime. Elevate your Trading Game with ChartPrime. Access Here.
- BlockOffsets. Modernizing Environmental Offset Ownership. Access Here.
- Source: https://www.newsbtc.com/analysis/btc/bitcoin-price-next-leg-lower-28800/
- :is
- $UP
- 000
- 1
- 100
- 200
- 220
- 300
- 320
- 50
- 500
- a
- above
- also
- and
- any
- ARE
- At
- average
- bearish
- below
- Bitcoin
- Bitcoin Price
- Break
- breaks
- BTC
- BTC/USD
- Bulls
- by
- call
- case
- Chart
- clear
- Close
- coming
- Connecting
- continue
- could
- data
- Days
- decent
- Decline
- down
- downside
- Drop
- Even
- Face
- faced
- fails
- fight
- followed
- For
- formed
- fresh
- fresh increase
- from
- gaining
- High
- HTTPS
- if
- immediate
- in
- Increase
- index
- Indicators
- IT
- Key
- Kraken
- Level
- levels
- like
- Line
- losses
- Low
- lower
- MACD
- major
- max-width
- might
- more
- move
- moves
- moving
- moving average
- must
- Near
- NewsBTC
- next
- now
- of
- on
- or
- Pace
- pair
- plato
- Plato Data Intelligence
- PlatoData
- positive
- price
- Putting
- reasons
- relative
- relative strength index
- remain
- Resistance
- retracement
- Rise
- Risk
- rsi
- seems
- settle
- Simple
- some
- Spark
- start
- stated
- steady
- strength
- Struggling
- support
- support levels
- Swing
- term
- The
- There.
- to
- toward
- Trading
- TradingView
- Trend
- Underway
- uptrend
- was
- with
- zephyrnet