Bitcoin price is struggling to clear the $23,650 resistance. BTC must clear the $24,000 resistance to move into a positive zone in the near term.
- Bitcoin is struggling to gain pace for a move above the $23,600 resistance zone.
- The price is trading above $23,200 and the 100 hourly simple moving average.
- There was a break below a key rising channel with support near $23,450 on the hourly chart of the BTC/USD pair (data feed from Kraken).
- The pair could resume its decline if it stays below the $23,650 and $24,000 resistance levels.
Bitcoin Price Keeps Struggling
Bitcoin price started a recovery wave from the $22,750 support zone. BTC formed a base and started a decent increase above the $23,200 resistance zone.
There was a move above the $23,600 resistance and the 100 hourly simple moving average. However, the bears were active below the $24,000 resistance zone. A high was formed near $23,885 before the price started a fresh decline.
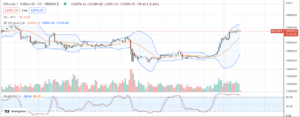
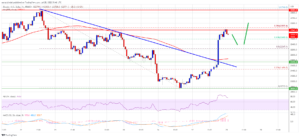
There was a move below the $23,600 zone. Besides, there was a break below a key rising channel with support near $23,450 on the hourly chart of the BTC/USD pair. There was a spike below the 50% Fib retracement level of the upward move from the $22,739 swing low to $23,885 high.
Bitcoin price is now trading above $23,200 and the 100 hourly simple moving average. It is stab above the 61.8% Fib retracement level of the upward move from the $22,739 swing low to $23,885 high.
An immediate resistance is near the $23,650 zone. The first major resistance is still near the $23,850 and $24,000 levels. A clear move above the $24,000 resistance might start a decent increase towards the $24,600 resistance zone.

Source: BTCUSD on TradingView.com
The next key resistance is still near the $25,000 zone. A close above the $25,000 resistance could push the price in a bullish zone. In the stated case, the price may perhaps rise towards the $25,800 level.
Fresh Decline in BTC?
If bitcoin price fails to clear the $23,650 resistance, it could continue to move down. An immediate support on the downside is near the $23,200 zone.
The next major support is near the $22,800 zone. If there is a downside break, the price might decline towards $22,200. The next major support is near the $22,000 level.
Technical indicators:
Hourly MACD – The MACD is now losing pace in the bearish zone.
Hourly RSI (Relative Strength Index) – The RSI for BTC/USD is now above the 50 level.
Major Support Levels – $23,200, followed by $22,800.
Major Resistance Levels – $23,650, $24,000 and $24,600.
- SEO Powered Content & PR Distribution. Get Amplified Today.
- Platoblockchain. Web3 Metaverse Intelligence. Knowledge Amplified. Access Here.
- Source: https://www.newsbtc.com/analysis/btc/bitcoin-price-recovery-fade-24k/
- 000
- 100
- a
- above
- active
- and
- average
- base
- bearish
- Bears
- before
- below
- Bitcoin
- Bitcoin Price
- Break
- BTC
- BTC/USD
- Bullish
- case
- Channel
- Chart
- clear
- Close
- continue
- could
- data
- Decline
- down
- downside
- fade
- fails
- First
- followed
- formed
- fresh
- from
- Gain
- High
- However
- HTTPS
- immediate
- in
- Increase
- index
- Indicators
- IT
- Key
- key resistance
- Kraken
- Level
- levels
- losing
- Low
- MACD
- major
- max-width
- might
- move
- moving
- moving average
- Near
- NewsBTC
- next
- Pace
- perhaps
- plato
- Plato Data Intelligence
- PlatoData
- positive
- price
- Push
- recovery
- relative strength index
- Resistance
- resume
- retracement
- Rise
- rising
- rsi
- Simple
- Soon
- spike
- start
- started
- stated
- Still
- strength
- Struggling
- support
- support levels
- surpass
- The
- to
- towards
- Trading
- TradingView
- upward
- Wave
- zephyrnet