Bitcoin price is eyeing a key upside break above the $27,500 resistance. BTC could rally further toward $28,200 if there is a close above $27,500.
- Bitcoin is showing positive signs and facing hurdles near $27,500.
- The price is trading above $26,850 and the 100 hourly Simple moving average.
- There is a major bullish trend line forming with support near $26,800 on the hourly chart of the BTC/USD pair (data feed from Kraken).
- The pair could rally further if there is a clear move above the $27,500 resistance.
Bitcoin Price Eyes More Upsides
Bitcoin price started another increase above the $26,800 resistance zone. BTC remained well-bid and even settled above the $27,000 pivot level.
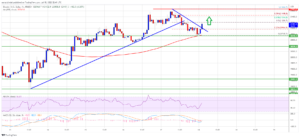
However, the bears are still active near the $27,500 zone. A high is formed near $27,494 and the price is now consolidating gains. It is trading just below the 23.6% Fib retracement level of the upward move from the $26,657 swing low to the $27,494 high.
Bitcoin is now trading above $26,850 and the 100 hourly Simple moving average. There is also a major bullish trend line forming with support near $26,800 on the hourly chart of the BTC/USD pair.
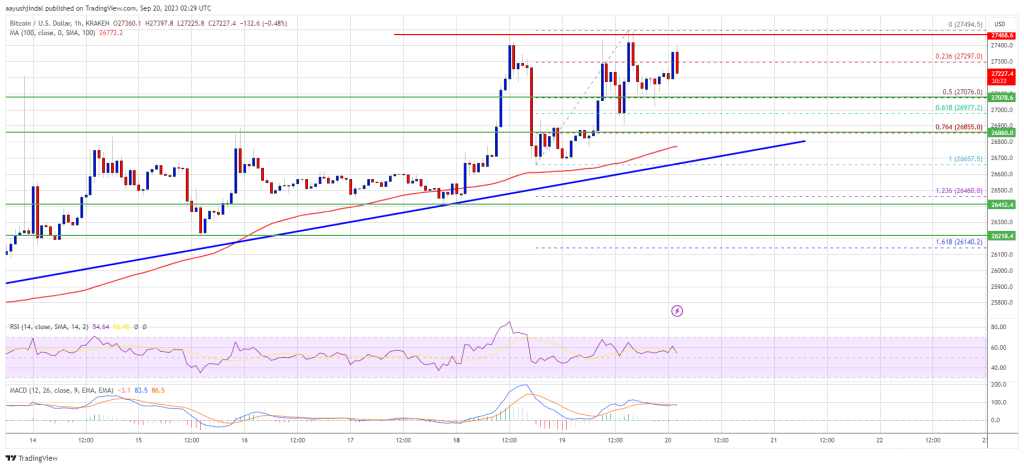
Source: BTCUSD on TradingView.com
It is consolidating gains and might eye a fresh increase. Immediate resistance on the upside is near the $27,450 level. The first major resistance is near the $27,500 zone, above which the price could start another rally. The next key resistance could be near the $28,200 level. A clear move above the $28,200 resistance could send the price toward the $29,500 resistance. In the stated case, the price could even test the $30,000 level in the coming days.
Are Dips Limited In BTC?
If Bitcoin fails to start a fresh increase above the $27,500 resistance, it could start a downside correction. Immediate support on the downside is near the $27,050 level.
The next major support is near the $26,800 level and the trend line. It is close to the 76.4% Fib retracement level of the upward move from the $26,657 swing low to the $27,494 high. A downside break and close below the $26,800 level might send the price toward the next support at $26,200.
Technical indicators:
Hourly MACD – The MACD is now losing pace in the bullish zone.
Hourly RSI (Relative Strength Index) – The RSI for BTC/USD is now above the 50 level.
Major Support Levels – $27,050, followed by $26,800.
Major Resistance Levels – $27,450, $27,500, and $28,200.
- SEO Powered Content & PR Distribution. Get Amplified Today.
- PlatoData.Network Vertical Generative Ai. Empower Yourself. Access Here.
- PlatoAiStream. Web3 Intelligence. Knowledge Amplified. Access Here.
- PlatoESG. Carbon, CleanTech, Energy, Environment, Solar, Waste Management. Access Here.
- PlatoHealth. Biotech and Clinical Trials Intelligence. Access Here.
- Source: https://www.newsbtc.com/analysis/btc/bitcoin-price-larger-rally-27500/
- :is
- 000
- 1
- 100
- 200
- 23
- 50
- 500
- a
- above
- active
- also
- and
- Another
- ARE
- At
- average
- BE
- Bears
- below
- Bitcoin
- Bitcoin Price
- Break
- BTC
- BTC/USD
- Bullish
- by
- case
- Chart
- clear
- Close
- coming
- consolidating
- could
- data
- Days
- Degree
- downside
- Even
- eye
- Eyes
- facing
- fails
- First
- followed
- For
- formed
- fresh
- fresh increase
- from
- further
- Gains
- High
- HTTPS
- Hurdles
- if
- immediate
- in
- Increase
- index
- Indicators
- IT
- just
- Key
- key resistance
- Kraken
- larger
- Level
- levels
- Limited
- Line
- losing
- Low
- MACD
- major
- max-width
- might
- more
- move
- moving
- moving average
- Near
- NewsBTC
- next
- now
- of
- on
- Pace
- pair
- Pivot
- plato
- Plato Data Intelligence
- PlatoData
- positive
- price
- rally
- relative
- relative strength index
- remained
- Resistance
- retracement
- rsi
- send
- Settled
- showing
- Signs
- Simple
- Spark
- start
- started
- stated
- Still
- strength
- support
- support levels
- Swing
- test
- The
- There.
- to
- toward
- Trading
- TradingView
- Trend
- Upside
- upward
- which
- with
- zephyrnet