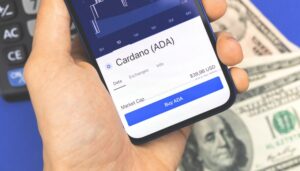
The Cardano price had attempted to reach the $0.38 level, but the bears have taken over, as seen on the daily chart. Over the last 24 hours, ADA has lost 3% of its value. In the previous week, the altcoin has not made considerable price movement, which implies that the altcoin is rangebound.
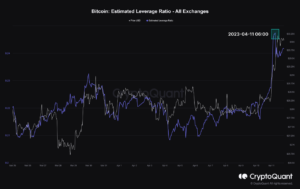
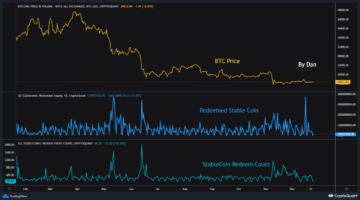
ADA fell by 3% in the weekly chart too. With the Bitcoin price slipping on its chart and falling below the $23,000 mark, other altcoin price movements have been hampered. As demand for the altcoin fell, the technical outlook for ADA suggested that the bulls had been defeated.
Accumulation also fell as there was a loss in demand for the altcoin. Moving past the $0.40 price level will help present a buying opportunity for ADA traders.
As the coin lost its crucial support line of $0.38, buyer confidence dipped, which can cause the altcoin to fall briefly before it attempted to make a return. Currently, ADA is 88% lower than its all-time high, secured in 2021.
Cardano Price Analysis: One-Day Chart
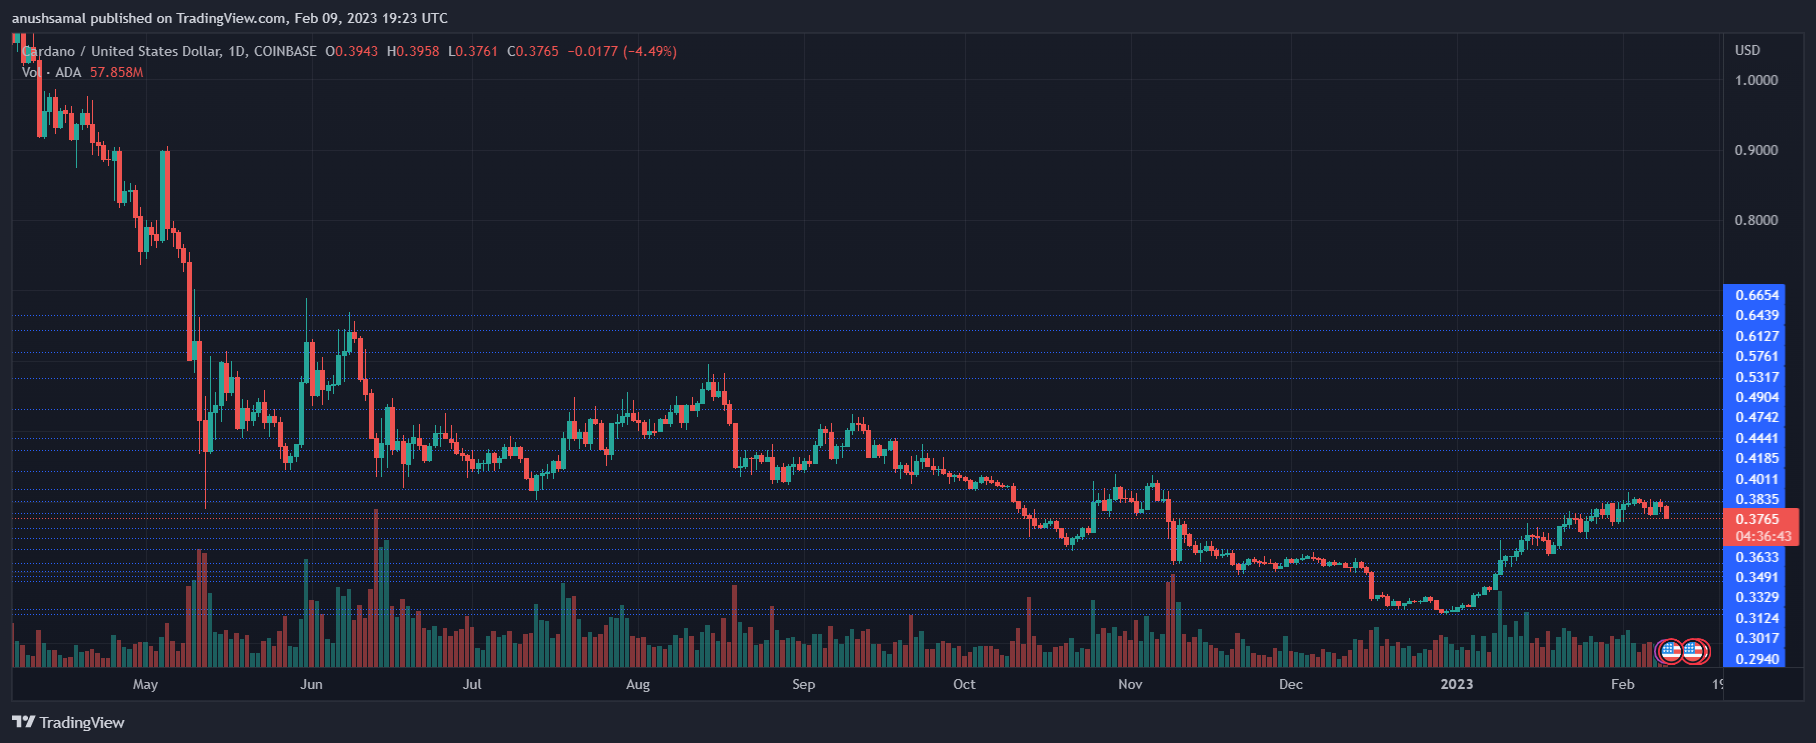
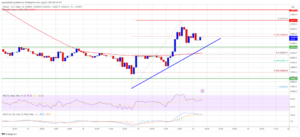
ADA traded at $0.37 at press time after losing the $0.38 support level. It is too early to tell if Cardano will attempt to break through $0.38 anytime soon. Indicators, however, highlight the chance of further price depreciation.
Moving above the $0.38 resistance will be challenging, but ADA can also expect to face a barrier at $0.40. If Cardano continues to lose demand, it will soon fall below the current price level and settle at $0.34 before it retraces further.
If ADA touches the $0.34 level, the altcoin can attempt to propel the price again. The amount of Cardano traded in the last session was low, suggesting a fall in buying strength.
Technical Analysis
The buying strength came crashing as soon as ADA fell off the $0.38 support line. The Relative Strength Index moved close to the half-line depicting sellers attempting to take over the market.
Although the indicator was near the half-line, buyers still had some leverage, but another fall in demand will cause the ADA to witness a surge in selling strength.
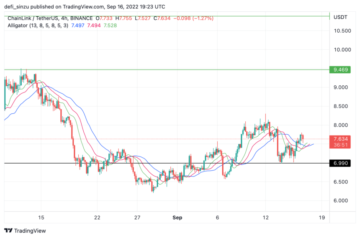
The Cardano price fell below the 20-Simple Moving Average (SMA) line over the past few trading sessions as sellers were starting to drive the price momentum in the market. As the altcoin was still above the 50-SMA (yellow) line, it was a sign that demand could appreciate with buyers stepping in.
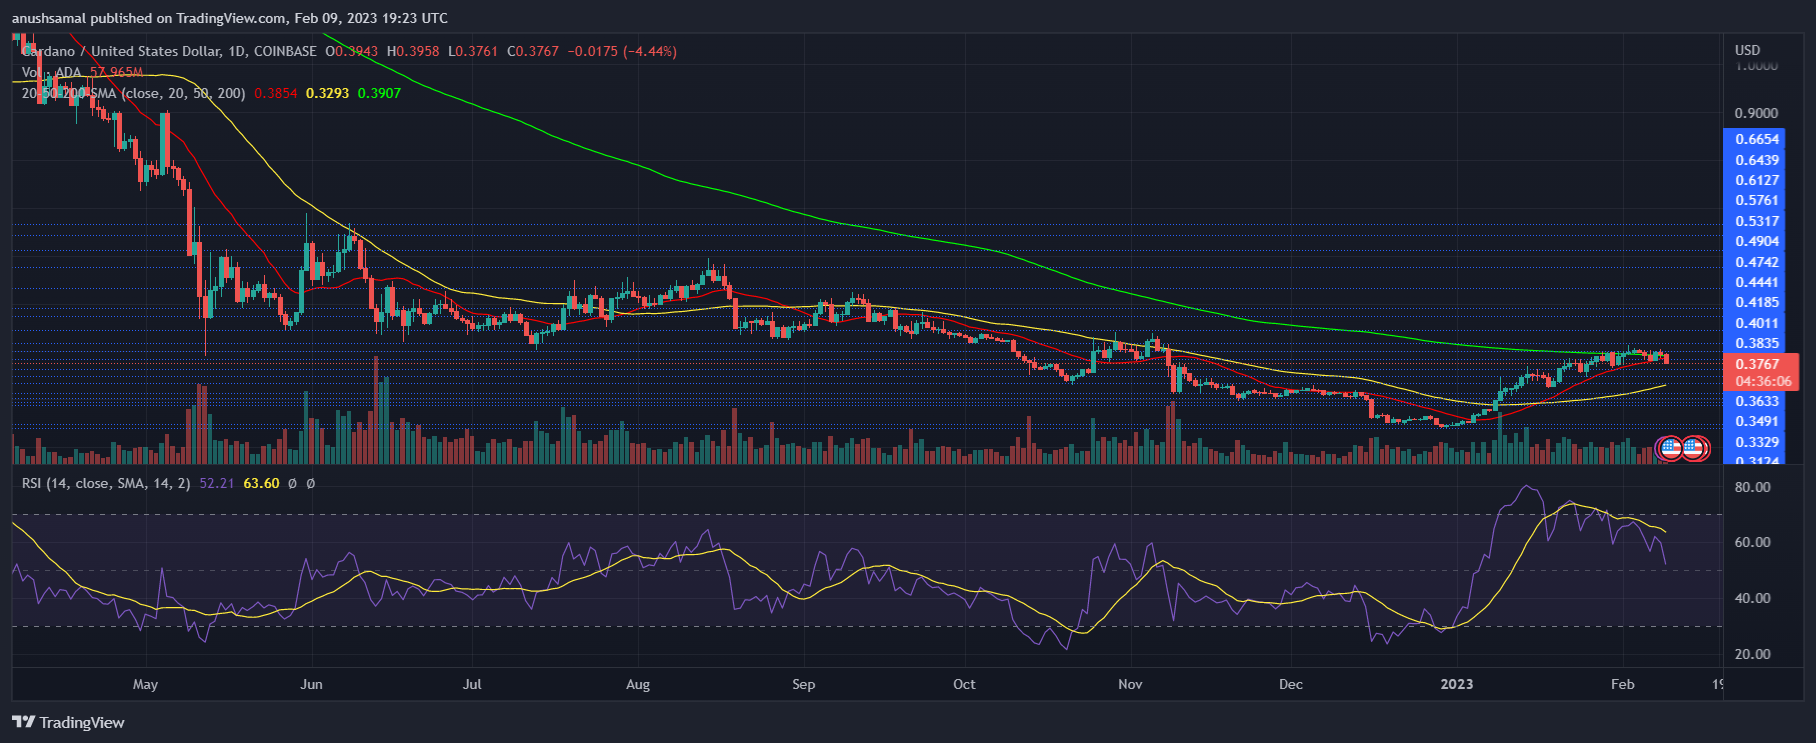
Sell signals were also visible on the chart, which meant that ADA might take another plunge before it recovers. The Awesome Oscillator shows the price momentum and strength of the same. The indicator depicted red histograms above the half-line as an indication to sell.
This was a bearish signal for the altcoin. Regarding buying strength, the Chaikin Money Flow, which portrays the capital inflows and outflows, was resting on the half-line after the downfall. This meant a fall in capital inflows for ADA.
Featured Image From UnSplash, Charts From TradingView.com
- SEO Powered Content & PR Distribution. Get Amplified Today.
- Platoblockchain. Web3 Metaverse Intelligence. Knowledge Amplified. Access Here.
- Source: https://www.newsbtc.com/news/cardano/bears-might-take-over-briefly-before-cardano-attempts-to-touch-this-level/
- $0.40
- 000
- 2021
- a
- above
- ADA
- After
- Altcoin
- Altcoin Price
- amount
- analysis
- and
- Another
- appreciate
- attempted
- attempting
- Attempts
- average
- barrier
- bearish
- Bears
- before
- below
- Bitcoin
- Bitcoin Price
- Break
- briefly
- Bulls
- buyers
- Buying
- capital
- Cardano
- cardano price
- Cause
- challenging
- Chance
- Chart
- Charts
- Close
- Coin
- confidence
- considerable
- continues
- could
- Crashing
- crucial
- Current
- Currently
- daily
- Demand
- depicting
- downfall
- drive
- Early
- expect
- Face
- Fall
- Falling
- few
- flow
- formed
- from
- further
- help
- High
- Highlight
- HOURS
- However
- HTTPS
- image
- in
- index
- indication
- Indicator
- Indicators
- inflows
- IT
- Last
- Level
- Leverage
- Line
- lose
- losing
- loss
- Low
- made
- make
- mark
- Market
- max-width
- might
- Momentum
- money
- movement
- movements
- moving
- moving average
- Near
- NewsBTC
- Opportunity
- Other
- outflows
- Outlook
- past
- plato
- Plato Data Intelligence
- PlatoData
- plunge
- portrays
- present
- press
- previous
- price
- Price Analysis
- Propel
- reach
- Recovers
- Red
- regarding
- registered
- relative strength index
- Resistance
- return
- same
- Secured
- sell
- Sellers
- Selling
- session
- sessions
- Shows
- sign
- Signal
- signals
- slipping
- SMA
- some
- Soon
- Source
- Starting
- stepping
- Still
- strength
- support
- support level
- surge
- Take
- Technical
- The
- The Capital
- The Weekly
- Through
- time
- to
- too
- touch
- traded
- Traders
- Trading
- Trading sessions
- TradingView
- Unsplash
- value
- visible
- week
- weekly
- which
- will
- witness
- zephyrnet