Earn Your First Bitcoin Sign up and get $12 Bonus Referral bonus up to $3,000
- Bitcoin price started a fresh increase above the $27,500 zone against the US Dollar.
- The price is now trading above $27,400 and the 55 simple moving average (4 hours).
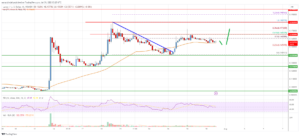
- There is a key contracting triangle forming with resistance near $28,000 on the 4-hour chart of the BTC/USD pair (data feed from Coinbase).
- The pair could continue to rise if it stays above the $27,150 support zone.
Bitcoin price is showing positive signs above $2,000 against the US Dollar. BTC might correct lower but dips could be limited below the $27,150 zone.
Bitcoin Price Analysis
Bitcoin price started a steady increase from the $26,000 support zone. The price gained and cleared many hurdles near the $26,500 and $27,000 levels.
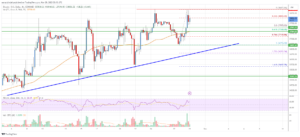
There was a clear move above the $27,500 level and the 55 simple moving average (4 hours). The price even rallied above the $28,000 resistance zone. However, the bears were active near the $28,500 zone. A high was formed near $28,473 before there was a downside correction.
The price traded below $28,000 and the 23.6% Fib retracement level of the upward move from the $25,864 swing low to the $28,473 high. The price is now trading well above $27,200 and the 55 simple moving average (4 hours).
Immediate resistance on the upside is near the $28,000 level. There is also a key contracting triangle forming with resistance near $28,000 on the 4-hour chart of the BTC/USD pair. The first major resistance is near the $28,500 level, above which the price could rise toward the $29,500 zone.
Any more gains might send the price toward the $30,000 zone. If there is no upside break, the price might start a downside correction below $27,500.
The next key support is near the $27,150 level or the 50% Fib retracement level of the upward move from the $25,864 swing low to the $28,473 high. Any more losses might call for a move toward the $26,550 support zone.

Bitcoin Price
Looking at the chart, Bitcoin price is trading above $27,200 and the 55 simple moving average (4 hours). Overall, the price could continue to rise if it stays above the $27,150 support zone.
Technical Indicators
4 hours MACD – The MACD is now losing momentum in the bullish zone.
4 hours RSI (Relative Strength Index) – The RSI is now above the 50 level.
Key Support Levels – $27,150 and $26,550.
Key Resistance Levels – $28,000, $28,500, and $29,000.
- SEO Powered Content & PR Distribution. Get Amplified Today.
- PlatoAiStream. Web3 Data Intelligence. Knowledge Amplified. Access Here.
- Minting the Future w Adryenn Ashley. Access Here.
- Buy and Sell Shares in PRE-IPO Companies with PREIPO®. Access Here.
- Source: https://www.livebitcoinnews.com/bitcoin-price-analysis-btc-faces-key-resistance-near-28-5k/
- :is
- $3
- $UP
- 000
- 200
- 23
- 28
- 50
- 500
- 7
- a
- above
- active
- against
- also
- analysis
- and
- any
- At
- average
- BE
- Bears
- before
- below
- Bitcoin
- Bitcoin News
- Bitcoin Price
- Bitcoin Price Analysis
- Bonus
- Break
- BTC
- BTC/USD
- Bullish
- but
- call
- Chart
- clear
- coinbase
- COM
- comments
- continue
- contracting
- correct
- could
- data
- Dollar
- downside
- end
- Even
- faces
- First
- follow
- For
- formed
- fresh
- fresh increase
- from
- Gains
- get
- High
- HOURS
- However
- HTTPS
- Hurdles
- if
- in
- Increase
- index
- internal
- IT
- Key
- key resistance
- Level
- levels
- Limited
- live
- Live Bitcoin News
- logo
- losing
- losses
- Low
- MACD
- major
- many
- might
- Momentum
- more
- move
- moving
- moving average
- Near
- news
- next
- no
- now
- of
- on
- or
- overall
- pair
- plato
- Plato Data Intelligence
- PlatoData
- positive
- Post
- price
- Price Analysis
- Referral
- relative strength index
- Resistance
- retracement
- Rise
- rsi
- send
- sign
- Signs
- Simple
- start
- started
- steady
- strength
- support
- support levels
- Swing
- TAG
- The
- There.
- to
- toward
- traded
- Trading
- TradingView
- Upside
- upward
- us
- US Dollar
- was
- WELL
- were
- which
- with
- Your
- zephyrnet