SNEAK PEEK
- TD Sequential buy setup suggests a bullish reversal on the BTC market.
- Widened Bollinger Bands indicate high volatility in the market.
- Bull Bear Power projects bullish solid momentum.
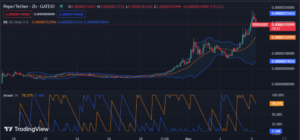
On May 4th, a TD sequential buy setup occurred on the Bitcoin (BTC) price chart suggesting that a trend reversal from bearish to bullish was likely. As a result of the bullish reversal pattern, BTC prices in the last 24 hours fluctuated between a 24-hour high of $29,259.53 and a low of $28,178.39.
$BTC reached my short-term targets! The TD never fails. ✅🎯 pic.twitter.com/eyOWCXyPB1
— Ali (@ali_charts) May 3, 2023
At this writing, BTC was trading at $29,136.89, up 1.85% from the day’s close, demonstrating that bullish control was still in place.
BTC’s market capitalization and 24-hour trading volume grew by 1.86% and 17.78%, reaching $564,103,982,739 and $19,363,891,932, respectively. The increase shows traders’ expectation that bulls would convert the present resistance level of $29,259.53 into support, paving the way for a rally toward the $30,000 mark.
On the BTC market’s 4-hour price chart, the Chande Momentum oscillator (ChandeMo) has its line facing North with a value of 60.97. This move suggests buyers are in charge of the market, and the BTC market is exhibiting strong bullish momentum. At this point, traders might consider purchasing BTC or holding onto their existing positions to ride the upward trend.
The widened Bollinger bands, with upper readings of $29645.37 and lower readings of $28750.20, show the highly volatile market. This movement suggests that there will be a significant price change soon. On the other hand, the distance between the BTC market’s upper and lower bands, 895.17, shows moderate market volatility.
The readings for the Kelter channel bands on the 4-hour price chart of the BTC market are upper $29462.10, middle $29125.19, and lower reading is $28667.84. These readings indicate that there may be a price increase toward the upper channel while the BTC market is currently in a moderately bullish trend.
On the BTC market’s 4-hour price chart, the Bull Bear Power (BBP) is pointing North and has a value of 30.87. This motion suggests that the bulls are taking control of the market and that buying pressure is rising. To benefit from this bullish momentum, traders may consider taking a long position or holding onto their existing positions.
In conclusion, the market shows bullish control with a moderately bullish trend and rising buying pressure. Bulls need to push past resistance to maintain the positive rally.
Disclaimer: Cryptocurrency price is highly speculative and volatile and should not be considered financial advice. Past and current performance is not indicative of future results. Always research and consult with a financial advisor before making investment decisions.
- SEO Powered Content & PR Distribution. Get Amplified Today.
- PlatoAiStream. Web3 Data Intelligence. Knowledge Amplified. Access Here.
- Minting the Future w Adryenn Ashley. Access Here.
- Buy and Sell Shares in PRE-IPO Companies with PREIPO®. Access Here.
- Source: https://investorbites.com/bitcoin-btc-price-analysis-05-04/
- :has
- :is
- :not
- $UP
- 000
- 1
- 10
- 20
- 22
- 24
- 30
- 39
- 4th
- 84
- a
- advice
- advisor
- always
- analysis
- and
- ARE
- AS
- At
- BE
- Bear
- bearish
- before
- benefit
- between
- Bitcoin
- Bitcoin News
- Bitcoin Price
- Bitcoin Price Analysis
- Bollinger bands
- BTC
- BTC Prices
- btc rebound
- bull
- Bullish
- Bulls
- buy
- buyers
- Buying
- by
- capitalization
- Center
- change
- Channel
- charge
- Chart
- Close
- conclusion
- Consider
- considered
- control
- convert
- Current
- Currently
- decisions
- demonstrating
- distance
- Ether (ETH)
- Exhibiting
- existing
- expectation
- external
- facing
- fails
- financial
- financial advice
- fluctuated
- For
- from
- future
- hand
- High
- highly
- hold
- holding
- HOURS
- HTTPS
- in
- Increase
- indicate
- internal
- into
- investment
- ITS
- Last
- Level
- likely
- Line
- Long
- Low
- maintain
- Making
- mark
- Market
- Market Capitalization
- Market News
- market volatility
- May..
- Middle
- might
- Momentum
- motion
- move
- movement
- Need
- never
- news
- North
- occurred
- of
- on
- or
- Other
- past
- Pattern
- Paving
- performance
- Place
- plato
- Plato Data Intelligence
- PlatoData
- Point
- position
- positions
- positive
- power
- present
- pressure
- price
- Price Analysis
- price chart
- Price Increase
- Prices
- projects
- purchasing
- Push
- rally
- reached
- reaching
- Reading
- rebound
- research
- Resistance
- respectively
- result
- Results
- Reversal
- Ride
- rising
- setup
- short-term
- should
- show
- Shows
- significant
- solid
- Soon
- Still
- strong
- Suggests
- support
- taking
- targets
- TD
- TD Sequential
- that
- The
- their
- There.
- These
- this
- to
- toward
- Traders
- Trading
- trading volume
- Trend
- upward
- value
- volatile
- Volatility
- volume
- was
- Way..
- What
- What is
- What is bitcoin
- while
- will
- with
- would
- writing
- zephyrnet