SNEAK PEEK
- LINK’s bullish trend suggests the potential for continued growth.
- Positive CMF and Bull Bear Power indicators support a bullish outlook.
- High volatility in the LINK market may lead to significant price movements.
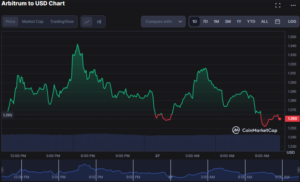
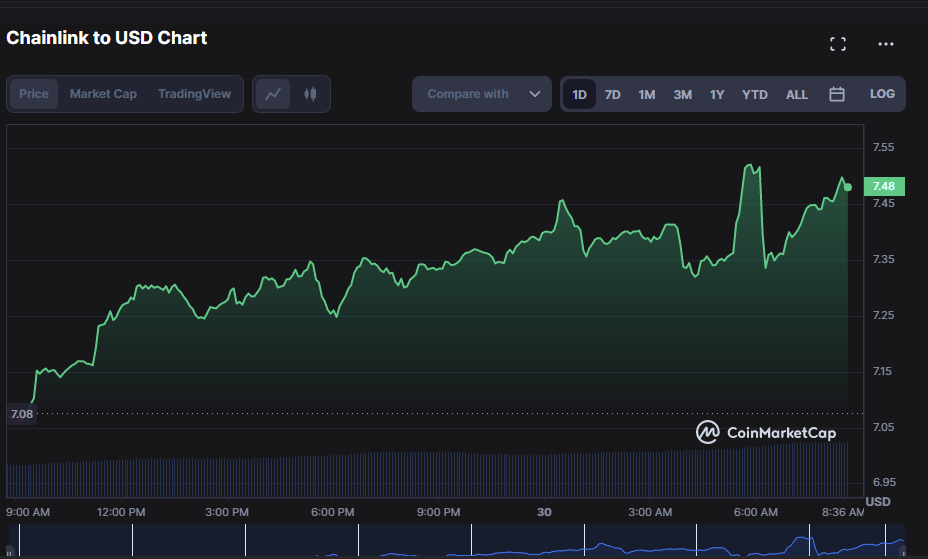
Bulls have dominated the Chainlink market (LINK) over the past 24 hours, driving prices from intraday lows of $7.06 to highs of $7.53. The market may soon continue to rise due to this surge, indicating that investors strongly prefer buying. This price increase can be attributed to the generally bullish outlook in the cryptocurrency market.
Due to the ongoing bullish trend, the price has increased by 5.75% to $7.48 as of press time. As a result, investors are optimistic about the company’s financial performance and anticipate further growth in the upcoming months. This price increase might also entice new buyers to the market.
Market capitalization and 24-hour trading volume increased to $3,866,487,457 and $353,906,464, respectively, by 5.92% and 66.21%. These values indicate a significant increase in the asset’s market value and trading activity, with traders hopeful of a sustained bull rally.
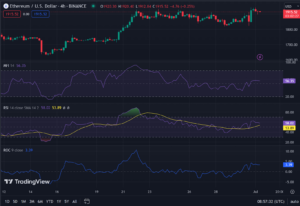
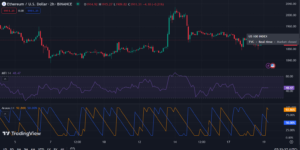
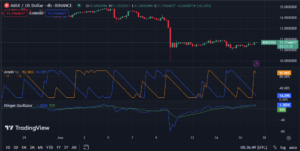
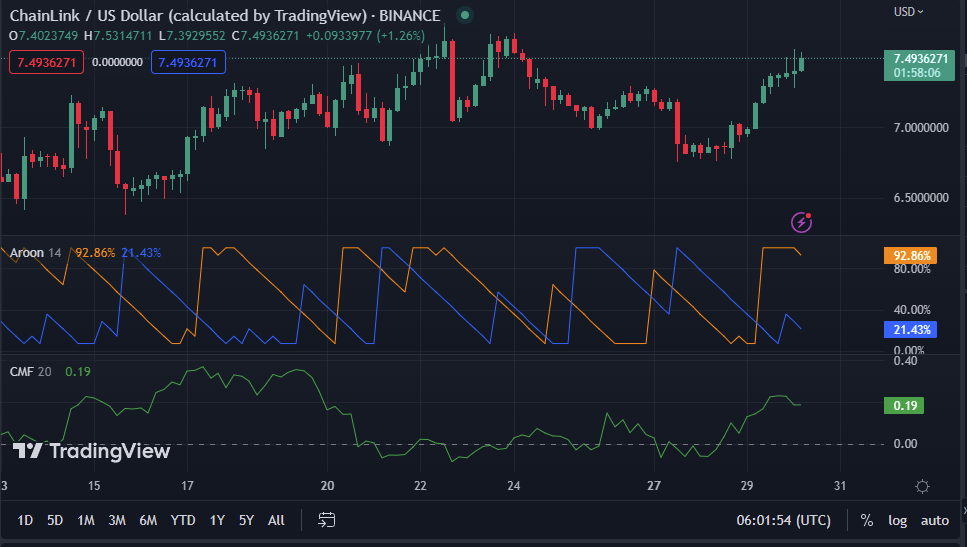
The Chaikin Money Flow (CMF) value of 0.18 in the LINK market, which is positive, may indicate a bullish outlook for the coin’s future performance. As a result of this trend, investors are buying more LINK tokens than they are selling, as indicated by a positive CMF.
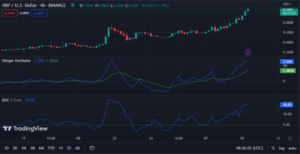
The values for the Aroon up and down on the 4-hour price chart are 92.86% and 21.43%, respectively. Although there may be brief reversals or corrections along the way, this movement indicates that the trend is solid and likely to last for a while, allowing traders to pinpoint potential entry and exit points for trades.
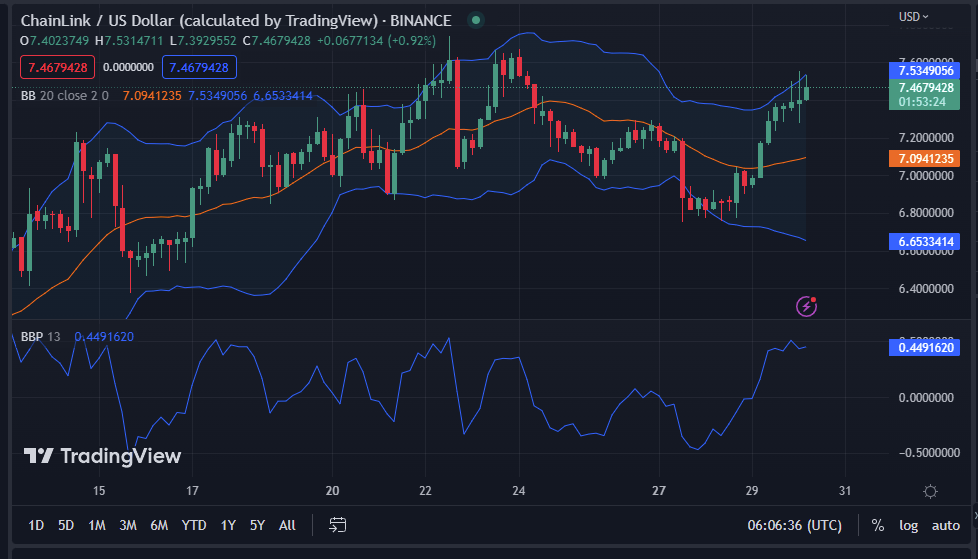
The Bull Bear Power value of 0.4492490 is positive and has a north line, indicating that the market’s purchasing power is slightly greater than its selling power. The upward trend of bullish power bolsters traders’ hope of a continued bullish hegemony since bullish strength is growing.
The distended Bollinger bands, which have upper readings of 7.5374762 and lower readings of 6.625255, demonstrate the high level of market volatility. According to this movement, the short term is expected to see a significant price movement. The upper and lower bands of the LINK currency market are separated by 0.9122212, indicating a moderate level of market volatility.
LINK is experiencing a bullish surge with positive indicators and high market volatility, signaling potential growth for investors.
Disclaimer: Cryptocurrency price is highly speculative and volatile and should not be considered financial advice. Past and current performance is not indicative of future results. Always research and consult with a financial advisor before making investment decisions.
- SEO Powered Content & PR Distribution. Get Amplified Today.
- Platoblockchain. Web3 Metaverse Intelligence. Knowledge Amplified. Access Here.
- Source: https://investorbites.com/chainlink-link-price-analysis-30-3/
- :is
- $3
- $UP
- 7
- a
- About
- According
- activity
- advice
- advisor
- Allowing
- Although
- always
- analysis
- and
- anticipate
- ARE
- AS
- BE
- Bear
- before
- Bollinger bands
- bull
- Bullish
- Bulls
- buyers
- Buying
- by
- CAN
- capitalization
- Chainlink
- Chainlink Price
- Chainlink price analysis
- charge
- Chart
- Company’s
- considered
- continue
- continued
- Corrections
- cryptocurrency
- cryptocurrency market
- Currency
- Current
- decisions
- demonstrate
- down
- driving
- entry
- Exit
- expected
- experiencing
- financial
- financial advice
- financial performance
- flow
- For
- For Investors
- from
- further
- future
- generally
- greater
- Growing
- Growth
- Have
- High
- highly
- Highs
- hope
- hopeful
- HOURS
- HTTPS
- in
- Increase
- increased
- indicate
- indicated
- indicates
- indicating
- Indicators
- internal
- investment
- Investors
- ITS
- Last
- lead
- Level
- likely
- Line
- LINK
- LINK/USD
- Lows
- Making
- Market
- Market News
- market value
- market volatility
- max-width
- might
- money
- months
- more
- movement
- movements
- New
- news
- North
- of
- on
- ongoing
- Optimistic
- Outlook
- past
- performance
- plato
- Plato Data Intelligence
- PlatoData
- points
- positive
- potential
- power
- prefer
- press
- price
- Price Analysis
- price chart
- Price Increase
- Prices
- purchasing
- rally
- research
- respectively
- result
- Results
- Rise
- Selling
- Short
- should
- significant
- since
- solid
- Soon
- Source
- strength
- strongly
- Suggests
- support
- surge
- Surges
- Take
- that
- The
- These
- time
- to
- Tokens
- Traders
- trades
- Trading
- trading volume
- Trend
- upcoming
- upward
- value
- Values
- View
- volatile
- Volatility
- volume
- Way..
- which
- while
- with
- zephyrnet